Figure 4.

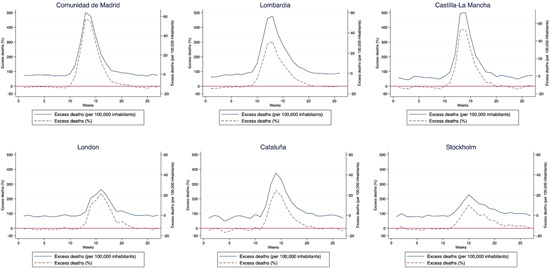
Evolution of excess mortality during the first wave of the COVID‐19 pandemic in the six hardest hit regions [Color figure can be viewed at wileyonlinelibrary.com]

Evolution of excess mortality during the first wave of the COVID‐19 pandemic in the six hardest hit regions [Color figure can be viewed at wileyonlinelibrary.com]