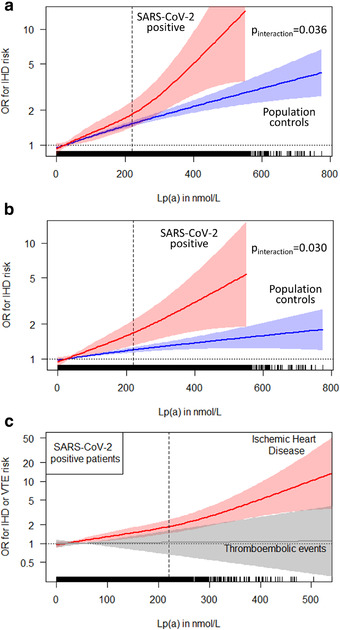
Fig. 2.

(a) Nonlinear splines describing the association between Lp(a) concentrations and ischemic heart disease (IHD) events in SARS‐CoV‐2 positive patients and in the population controls. Data are adjusted for age, sex, ethnicity, smoking, body mass index, diabetes mellitus, hypertension and Lp(a)‐corrected LDL cholesterol.p‐value for interaction = 0.036. The dotted line for OR = 1 crosses the spline at the Lp(a) median value of 19.6 nmol/L in all analysed individuals. The dashed vertical line corresponds to an Lp(a) level of 220 nmol/L (= 95th percentile). (b) is similar to panel (a) but additionally adjusted for prevalent IHD status from September 2019. p‐Value for interaction = 0.030. (c) Splines for IHD and venous thromboembolism outcomes in 6937 SARS‐CoV‐2 positive tested study participants. The dotted line for OR = 1 crosses the spline at the Lp(a) median value of 19.2 nmol/L. The dashed vertical line corresponds to an Lp(a) level of 220 nmol/L (= 95th percentile). In each plot, tick marks at the bottom line indicate one observation.
