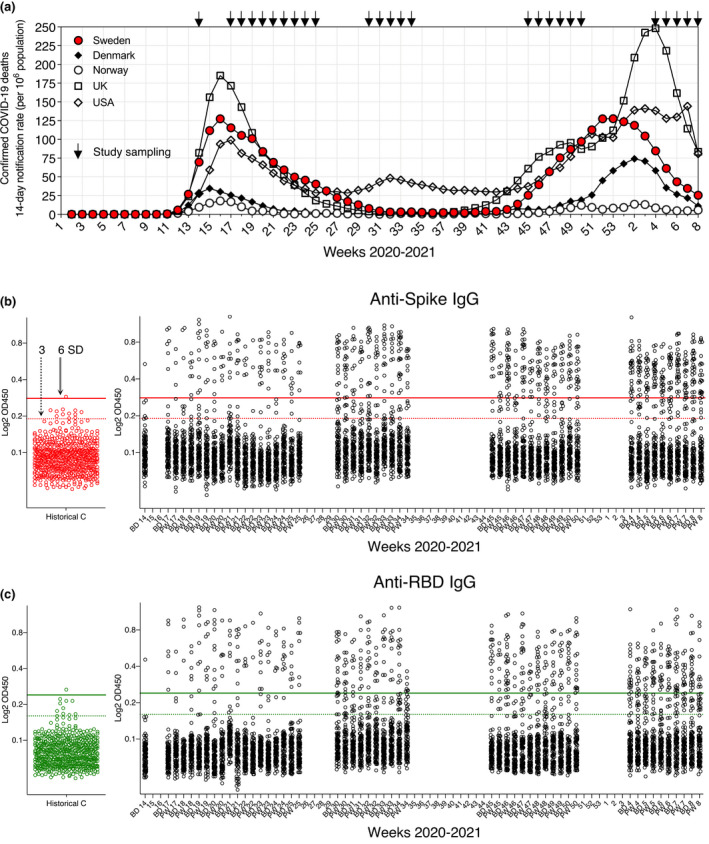
Fig. 1.

SARS‐CoV‐2 seropositivity estimates in Stockholm: March 2020–February 2021. (a) Population‐adjusted COVID‐19 deaths for selected countries during the pandemic. (b) Anti‐S IgG responses in blood donors (BD), pregnant women (PW) and n = 595 historical control (C) sera. 100 BD and 100 PW samples were analysed per sampling week alongside negative controls (cut‐out plot red points). Conventional 3 and 6 SD (from the mean of negative control values) assay cut‐offs are shown as dashed and solid lines, respectively. (c) Anti‐RBD IgG responses in BD, PW and n = 595 historical control sera (cut‐out plot green points). Conventional 3 and 6 SD assay cut‐offs are shown as dashed and solid lines, respectively
