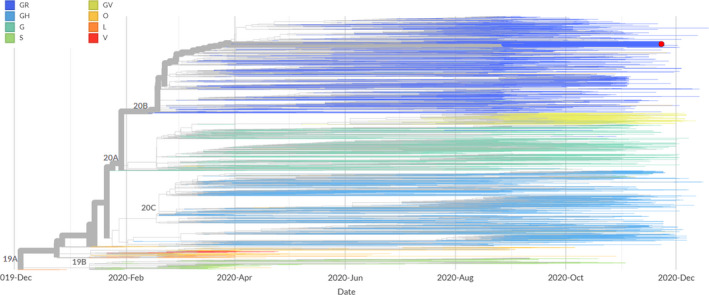
FIGURE 3.

Phylogenetic tree based on temporal data of European isolates and their global links. The tree was adapted by NextStrain (3,891 complete genomes as of 29/12/2020). Branch colours represent GISAID clades (G: includes the S‐D614G amino‐acid substitution; GH: includes the S‐D614G and the ORF3a‐Q57H amino‐acid substitutions; GR: includes the S‐D614G and the N‐G204R amino‐acid substitutions; GV: includes the S‐D614G and the S‐A222V amino‐acid substitutions; S: includes the ORF8‐L84S amino‐acid substitution; V: includes the NSP6‐L37F and the ORF3a‐G251V amino‐acid substitutions; L: contains sequences close to the reference genome; O: contains sequences not clustered into any of the major clades). NextStrain clades are depicted on the branch junctions. The red circle represents the strain of the current study
