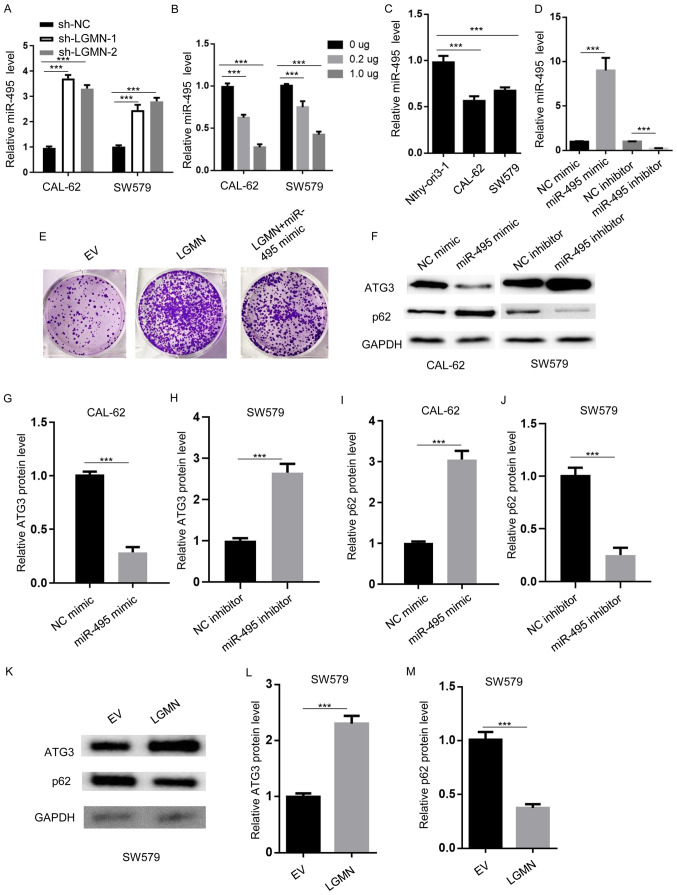
Figure 3.
miR-495 modulates autophagy. (A) RT-qPCR analysis was performed to determine the miR-495 expression levels in CAL-62 and SW579 cells transfected with sh-NC, sh-LGMN-1 or sh-LGMN-2. ***P<0.001. (B) RT-qPCR analysis of miR-495 expression levels in CAL-62 and SW579 cells transfected with the indicated amounts of pcDNA3.1-LGMN. ***P<0.001. (C) RT-qPCR was performed to establish the miR-495 expression levels in normal thyroid epithelial cells (Nthy-ori3-1) and thyroid carcinoma cells (CAL-62 and SW579). ***P<0.001. (D) RT-qPCR analysis of miR-495 expression levels in CAL-62 cells transfected with NC mimics, miR-495 mimics, NC inhibitor and miR-495 inhibitor. ***P<0.001. (E) Colony formation assay to determine the colony number of CAL-62 cells transfected with EV (pcDNA3.1), pcDNA3.1-LGMN, or pcDNA3.1-LGMN plus miR-495 mimics. (F-J) Western blot analysis was performed to measure the protein expression levels of ATG3 and p62 in CAL-62 cells transfected with NC or miR-495 mimics, and SW579 cells transfected with NC or miR-495 inhibitors. ***P<0.001. (K-M) Western blot analysis was carried out to determine the protein expression levels of ATG3 and p62 in SW579 cells transfected with EV (pcDNA3.1) or pcDNA3.1-LGMN. ***P<0.001. Experiments were performed for three biological replicates; western blotting was performed once (n=1). miR-495, microRNA-495; LGMN, pseudogene legumain; RT-q, reverse transcription-quantitative; sh-, short hairpin RNA; NC, negative control; ATG3, autophagy-related gene 3; EV, empty vector.

