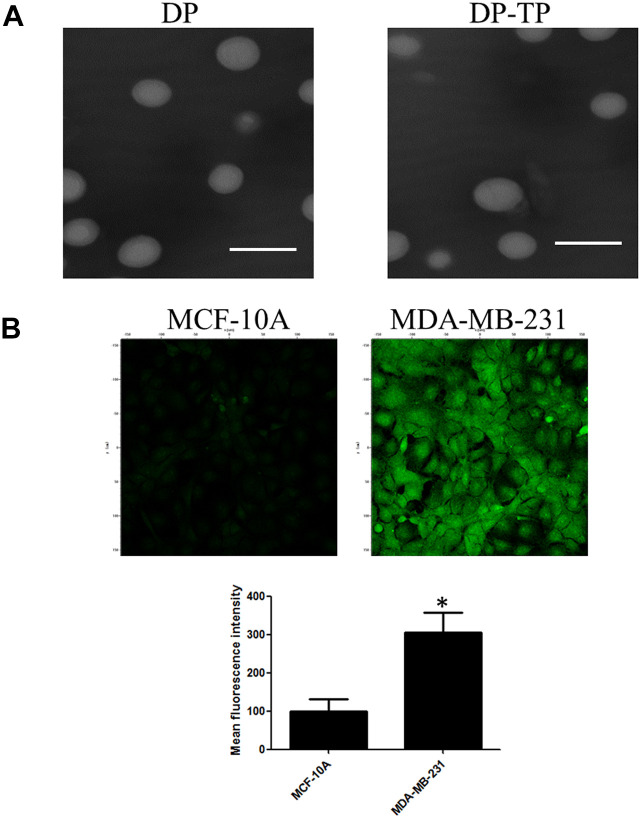
Figure 2.
The characterization of DP-TP nanomicelles and the correlation between the targeting nanomicelles and the NKA α1 expression levels. A, Transmission electron microscope image of DP and DP-TP. The scale bar is 200 nm. B, Confocal fluorescent images of cellular uptake of FAM-DP and FAM-DP-TP. Nanoparticles at 10 μM were incubated with MDA-MB-231 or MCF-10A cells for 1 h at 37°C and extra nanoparticles in the medium was washed away before the cells were imaged. The lower panel shows the mean fluorescent intensity of different cells (*P < 0.05).

