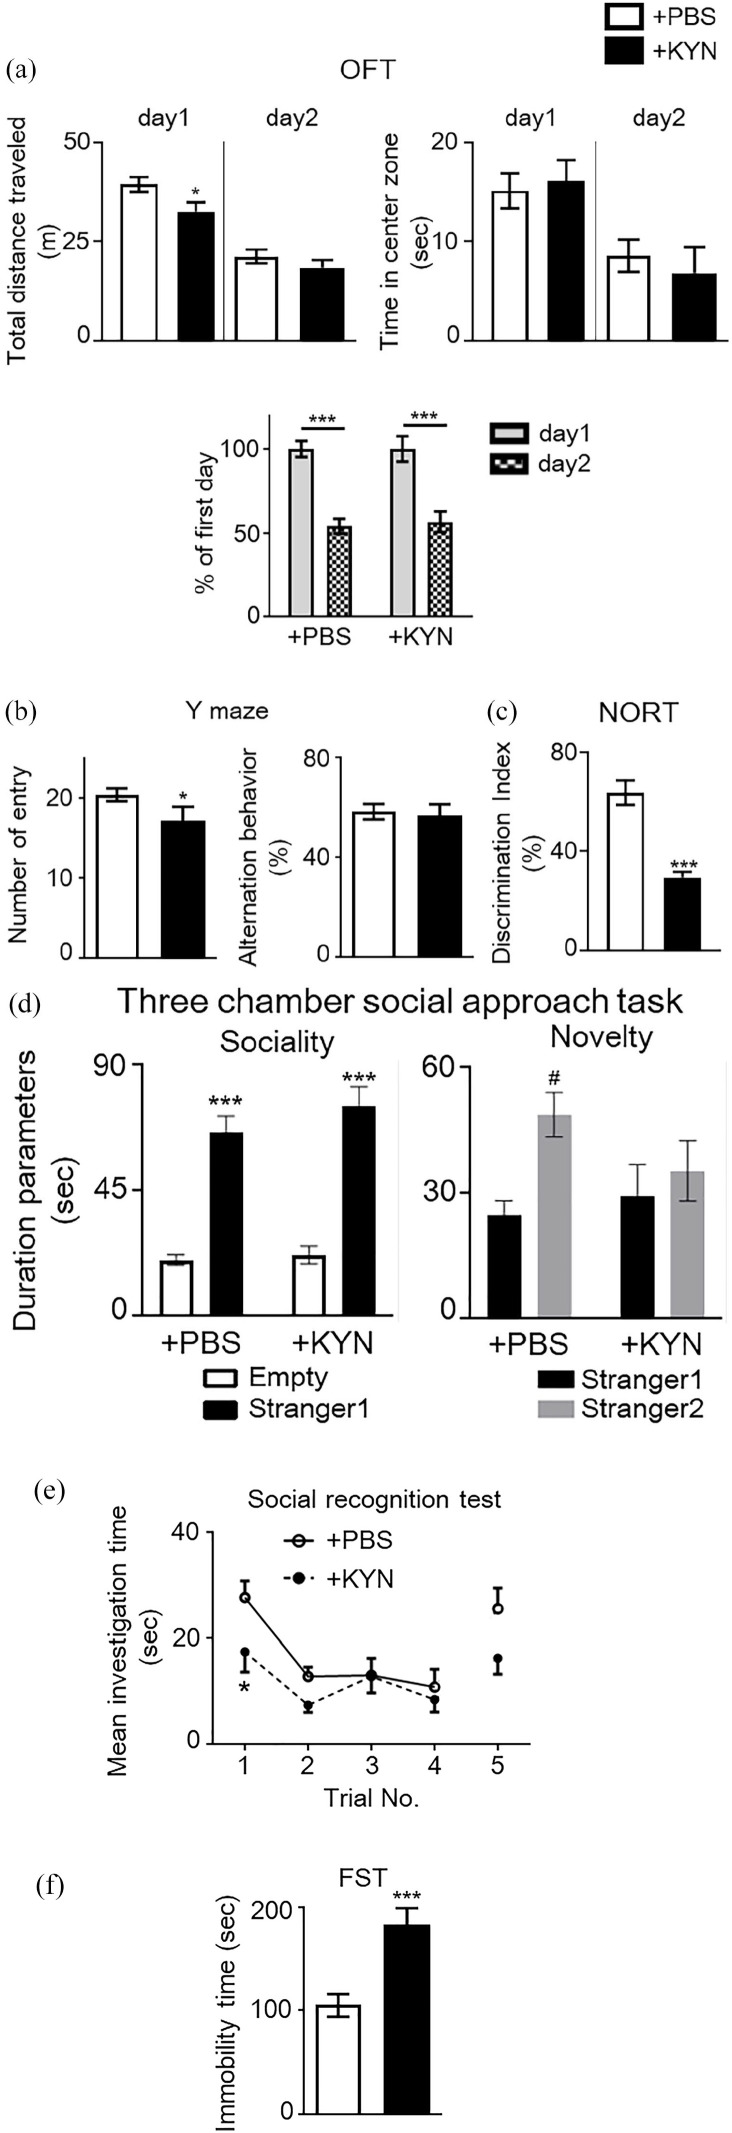
Figure 5.
Behavioral abnormalities in animals receiving a high dose of kynurenine (KYN) during the prenatal period. (a) Locomotor activity and anxiety-like behavior in a novel and habituated environments. Total distance traveled for 10 minutes was measured as an index of locomotor activity on 2 consecutive days. Time spent in each area was also measured. No significant difference in time spent in the center of the open field, which is an indicator of increased anxiety-like behavior, was observed between groups (Student’s t-test, *P < .05 vs + PBS mice). Additionally, habituation to a novel environment was evaluated. The ratio (percentage) of total distance traveled on the second day to that traveled on the first day was significantly decreased in both mouse groups over repeated trials, suggesting no differences in habituation to a novel environment [two-way analysis of variance (ANOVA) with Bonferroni’s multiple comparison test: ***P < .001 vs percentage of the first day]. (b) Spontaneous activity and working memory in the Y-maze test. Total arm entries and alternation behavior were measured during an 8-minutes session (Student’s t-test, *P < .05 vs + PBS mice). (c) Object recognition memory was measured in a novel object-based recognition test (NORT). Memory retention session was performed 24 hours after the training session. The discrimination index was calculated as described in the Methods (Student’s t-test: ***P < .001 vs control mice). (d) Three-chamber social approach test. Duration parameters are presented as investigation times (two-way ANOVA with Bonferroni’s multiple comparison test: ***P < .001 vs Empty; #P < .05 vs stranger1). No significant differences were observed between groups. Empty, empty cage. (e) Five-trial social recognition memory test. The investigation time in repeated trials was significantly shorter in MIA mice than in control mice (Trial 1; two-way repeated measures ANOVA: *P < .05 vs control mice). (f) Immobility of + PBS and + KYN mice in a forced swimming test (FST) (Student’s t-test: ***P < .001 vs control mice). Data are presented as means ± standard error of the mean (SEM; n = 7-11).

