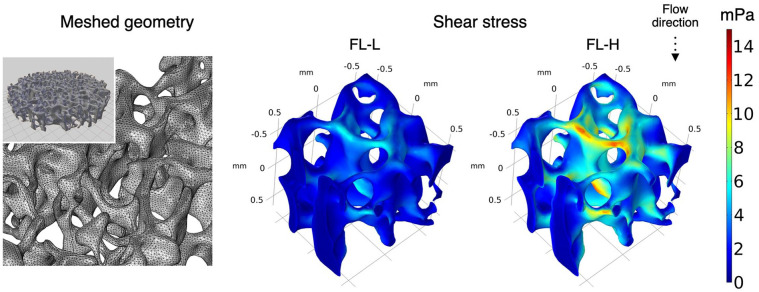
Figure 4.
In silico modelling using the actual scaffold geometry obtained by microCT to illustrate the distribution of shear stress within the scaffold, the scaffold geometry was obtained by microCT and imported to the processing softwires as stl. file. To reduce computational burden, 1.2 mm cube was dissected from the middle of the scaffold and computed.

