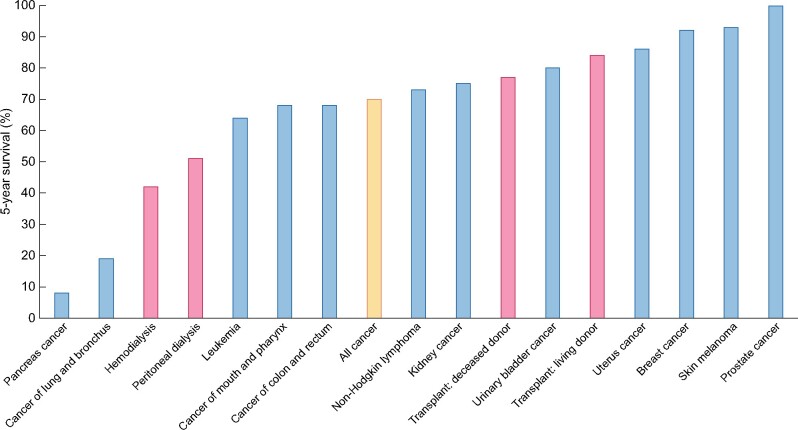
FIGURE 2:
Percent 5-year survival of kidney replacement treatment modalities (red bars) (HD, PD, transplantation after deceased donation and transplantation after living donation) or 5 years after the diagnosis of cancer (blue bars). Only malignancies with an incidence >3% of all cancers are illustrated. Orange bar: all cancers aggregated. Based on 2016 data [40, 41].

