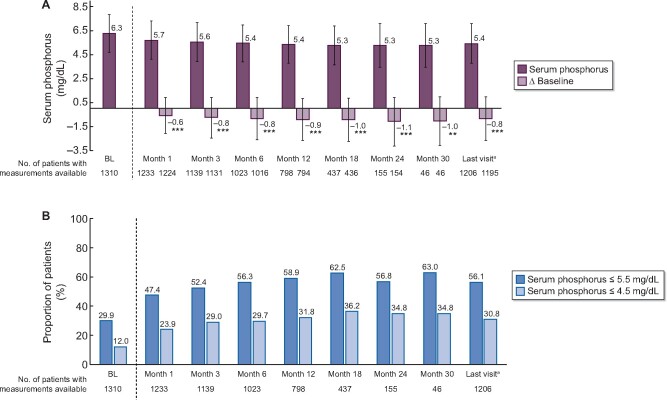
FIGURE 4:
Serum phosphorus control during the observation period (full analysis set; n = 1322). (A) Mean ± SD phosphorus concentrations and changes from BL over time. **P < 0.01, ***P < 0.001 versus BL. (B) Proportion of patients with serum phosphorus ≤5.5 and ≤4.5 mg/dL. aTo account for the effect of premature discontinuations, data for all patients at the last completed observation time point were summarized by a final follow-up: ‘last visit’. Data for Month 36 not shown due to low number of patients with follow-up data at this time point. In (A), bars show mean values and whiskers represent SDs.

