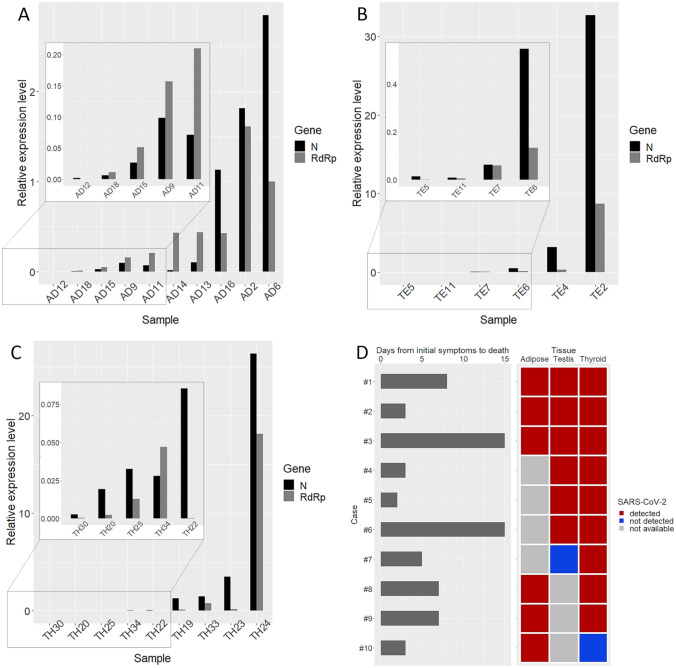
Fig. 1.
The bar plots show the relative abundance of SARS-CoV-2 nucleocapsid (N) and RNA-dependent RNA polymerase (RdRp) gene amplicons in adipose tissue (A), testis (B), and thyroid (C). Relative expression levels were computed by the 2−ΔΔCt method using the RT-PCR internal positive control as reference. Insects refer to cases with very low viral load that were not visible using the default scale. D Ten cases for which different organs were available. Left: grey bars represent days from initial symptoms to death as reported by family members. Right, detection of SARS-CoV-2 genome in matched samples (red, positive; blue, negative; grey, specimen not available)

