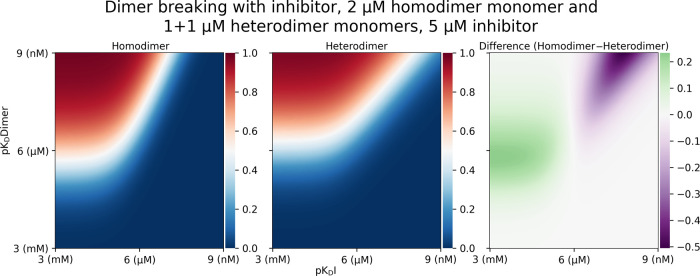
Figure 2.
Homo-vs-heterodimer dissociation heatmaps showing dimer concentration between 1 μM (red) and 0 μM (blue) as a function of changing dimer and inhibitor affinity expressed as pKD between 1 nM and 1 mM. Right panel shows the difference between the homodimer and heterodimer abundance heatmaps, with magenta representing less homodimer than heterodimer at a constant 5 μM inhibitor concentration.

