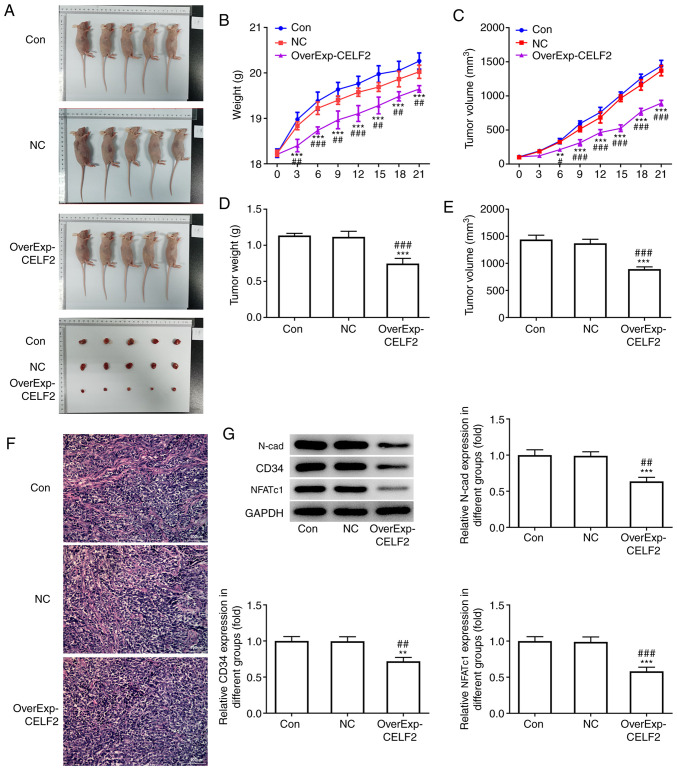
Figure 2.
CELF2 overexpression inhibits tumor growth and angiogenesis. (A) Mice and tumor in the three groups. (B) Mouse weight changed from day 0 to day 21. ***P<0.001 vs. Con group. ##P<0.01 and ###P<0.001 vs. NC group. (C) Tumor volume changed from day 0 to day 21. **P<0.01 and ***P<0.001 vs. Con group. #P<0.05 and ###P<0.001 vs. NC group. (D) Tumor weight at day 21. ***P<0.001 vs. Con group. ###P<0.001 vs. NC group. (E) Tumor volume at day 21. ***P<0.001 vs. Con group. ###P<0.001 vs. NC group. (F) Angiogenesis was analyzed by HUVEC tube formation assay; scale bar, 100 µm. (G) Western blot analysis was performed to detect the expression of proteins associated with invasion and angiogenesis and NFATc1 in tumor tissues. **P<0.01 and ***P<0.001 vs. Con group. ##P<0.01 and ###P<0.001 vs. NC group. CELF2, CUGBP Elav-like family member 2; NFATc1, nuclear factor of activated T cells 1; Con, control; NC, negative control.

