
Figure 1.
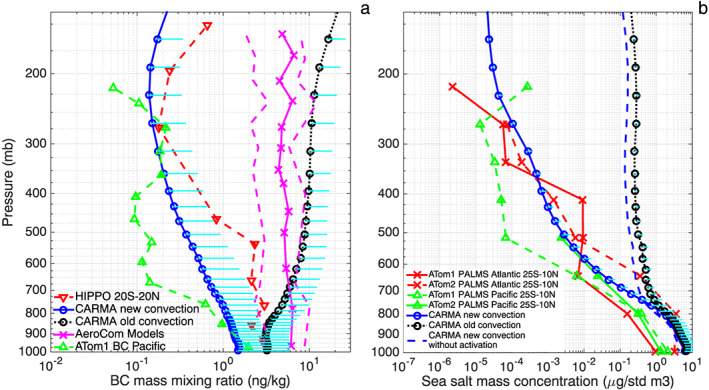
(a) Vertical profiles of black carbon aerosol mass mixing ratio in the tropics (20°S to 20°N) observed during the HIPPO field campaign (red; Schwarz et al., 2010) and ATom1 field campaign (green); simulated tropical profiles over the Pacific Ocean with old (black) and modified (blue) convection schemes in CESM/CARMA. Spatial variabilities (1 standard deviation) from the model are denoted by the cyan lines; simulations by the AeroCom models summarized by Schwarz et al. (2010) are shown in pink (model mean in solid, 25% and 75% in dashed); (b) vertical profiles of sea‐salt aerosol mass concentration (μg std m−3) in the tropics (25°S to 10°N) observed by PALMS during ATom field campaigns (red and green; Wofsy et al., 2018); simulated 0.2–3 micron sea‐salt concentration profiles with old (black) and modified (blue solid line) convection schemes by CESM/CARMA. Modeled sea‐salt profile using the modified convection but with activation turned off is denoted by the blue dashed line. Simulations are domain averaged rather than along the flight track, and monthly simulation output when the measurements were made is used. HIPPO = HIAPER Pole‐to‐Pole Observations; CARMA = Community Aerosol and Radiation Model for Atmospheres; AeroCom = Aerosol Comparisons between Observations and Models; ATom = Atmospheric Tomography Mission; PALMS = Particle Analysis by Laser Mass Spectrometry; BC = black carbon; CESM = Community Earth System Model.