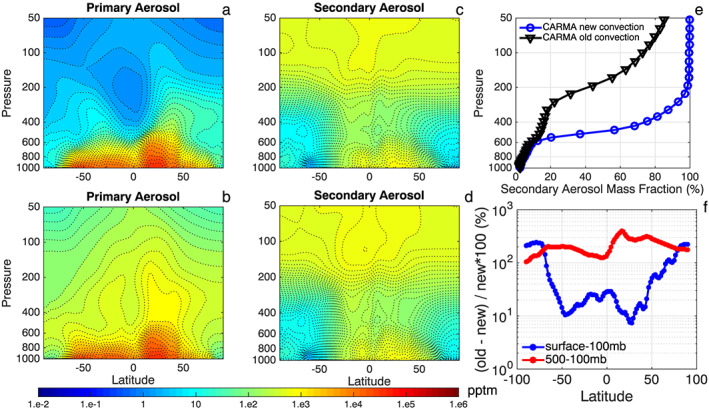
Figure 3.

(a) Simulated vertical profiles of zonal averaged primary aerosol mass mixing ratio (the sum of black carbon, dust, salt, and primary organics, unit: pptm) with the modified convection scheme; (b) same as (a) but with the default convection scheme; (c) same as (a) but for secondary particles (sum of sulfate and secondary organics); (d) same as (c) but with the default convection scheme in CESM/CARMA; (e) simulated global mean mass fraction of secondary particles (sulfate and secondary organics aerosols) to the total particles as a function of pressure; (f) fractional change (%) of the column aerosol mass density between the original and the modified convective transport schemes. Simulations averaged in the middle and upper troposphere (above pressure level of 500 hPa) are shown in red; those averaged from the surface to 100 hPa are shown in blue. CARMA = Community Aerosol and Radiation Model for Atmospheres.
