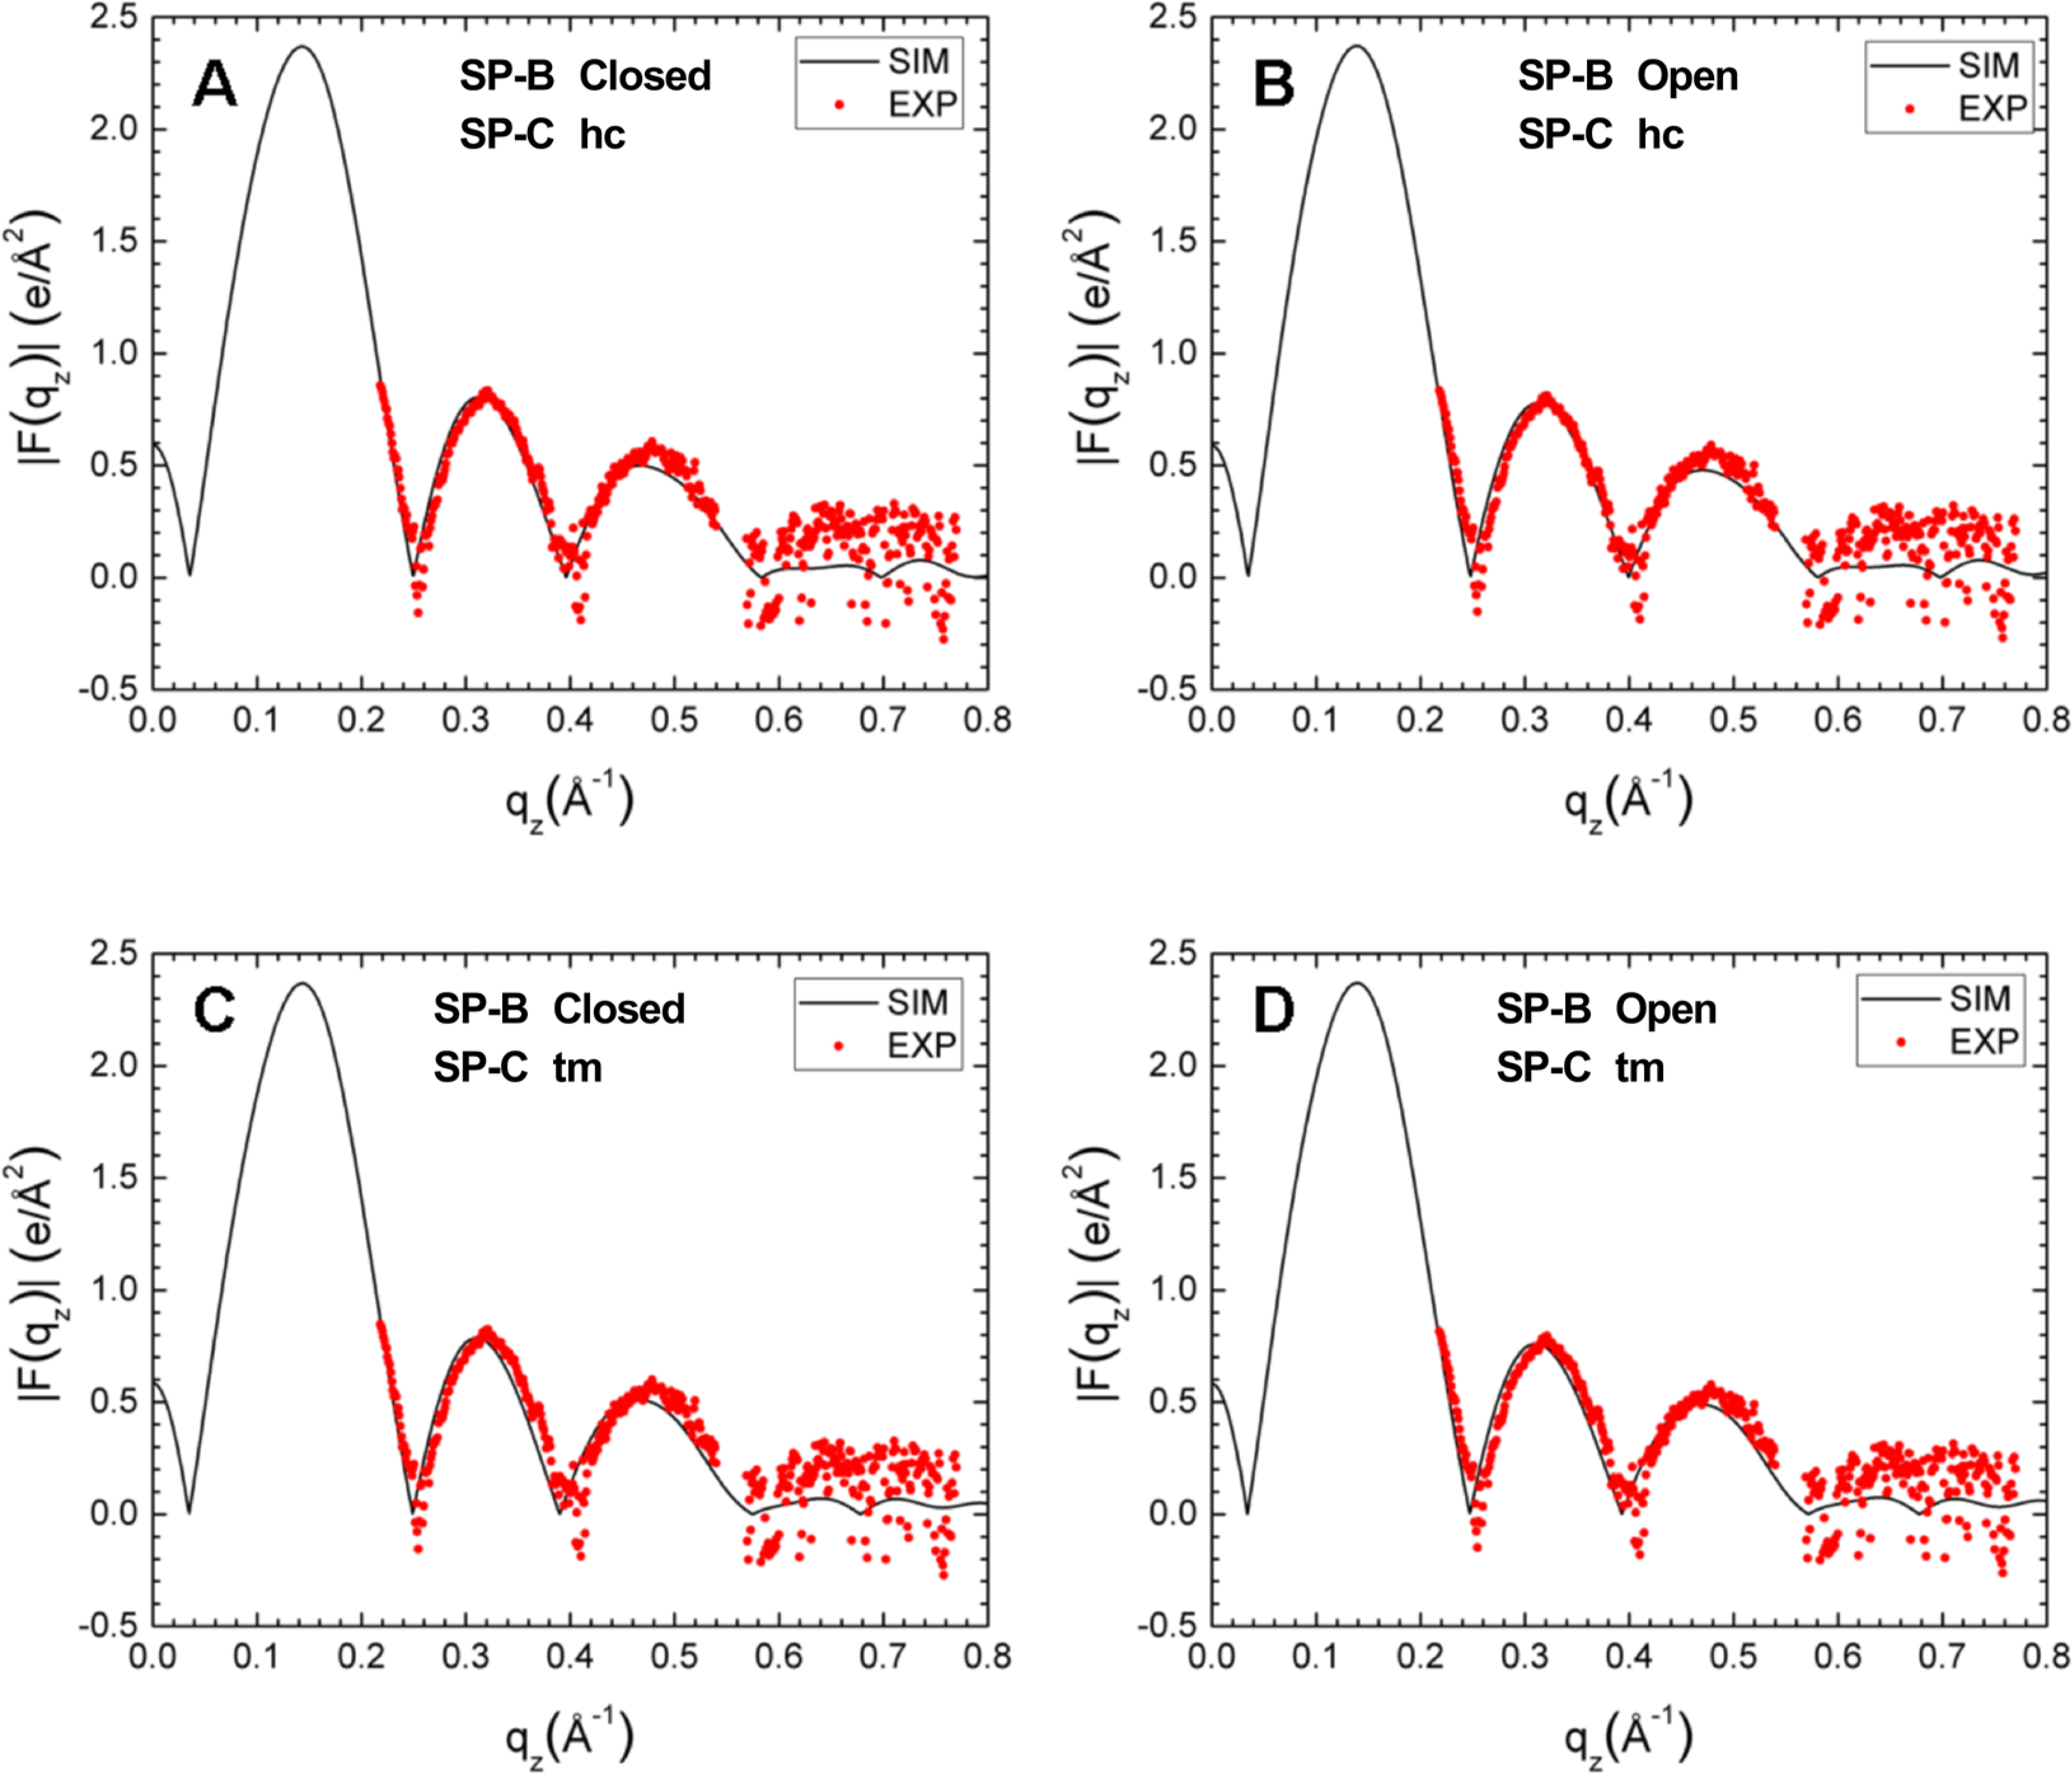
Figure 10.

Simulated form factors (black traces), generated by weight-averaging simulations with individual proteins, compared to the experimental form factor obtained with 3.0 wt % protein (red symbols). Numbers below in parentheses quantitate the average difference in qz up to 0.55 Å−1 between experimental and simulated form factors. (A) Simulated closed SP-B and SP-C in hydrocarbon (hc) (0.055). (B) Simulated open SP-B and SP-C in hc (0.060). (C) Simulated closed SP-B and transmembrane (tm) SP-C (0.072). (D) Simulated open SP-B and tm SP-C (0.071).
