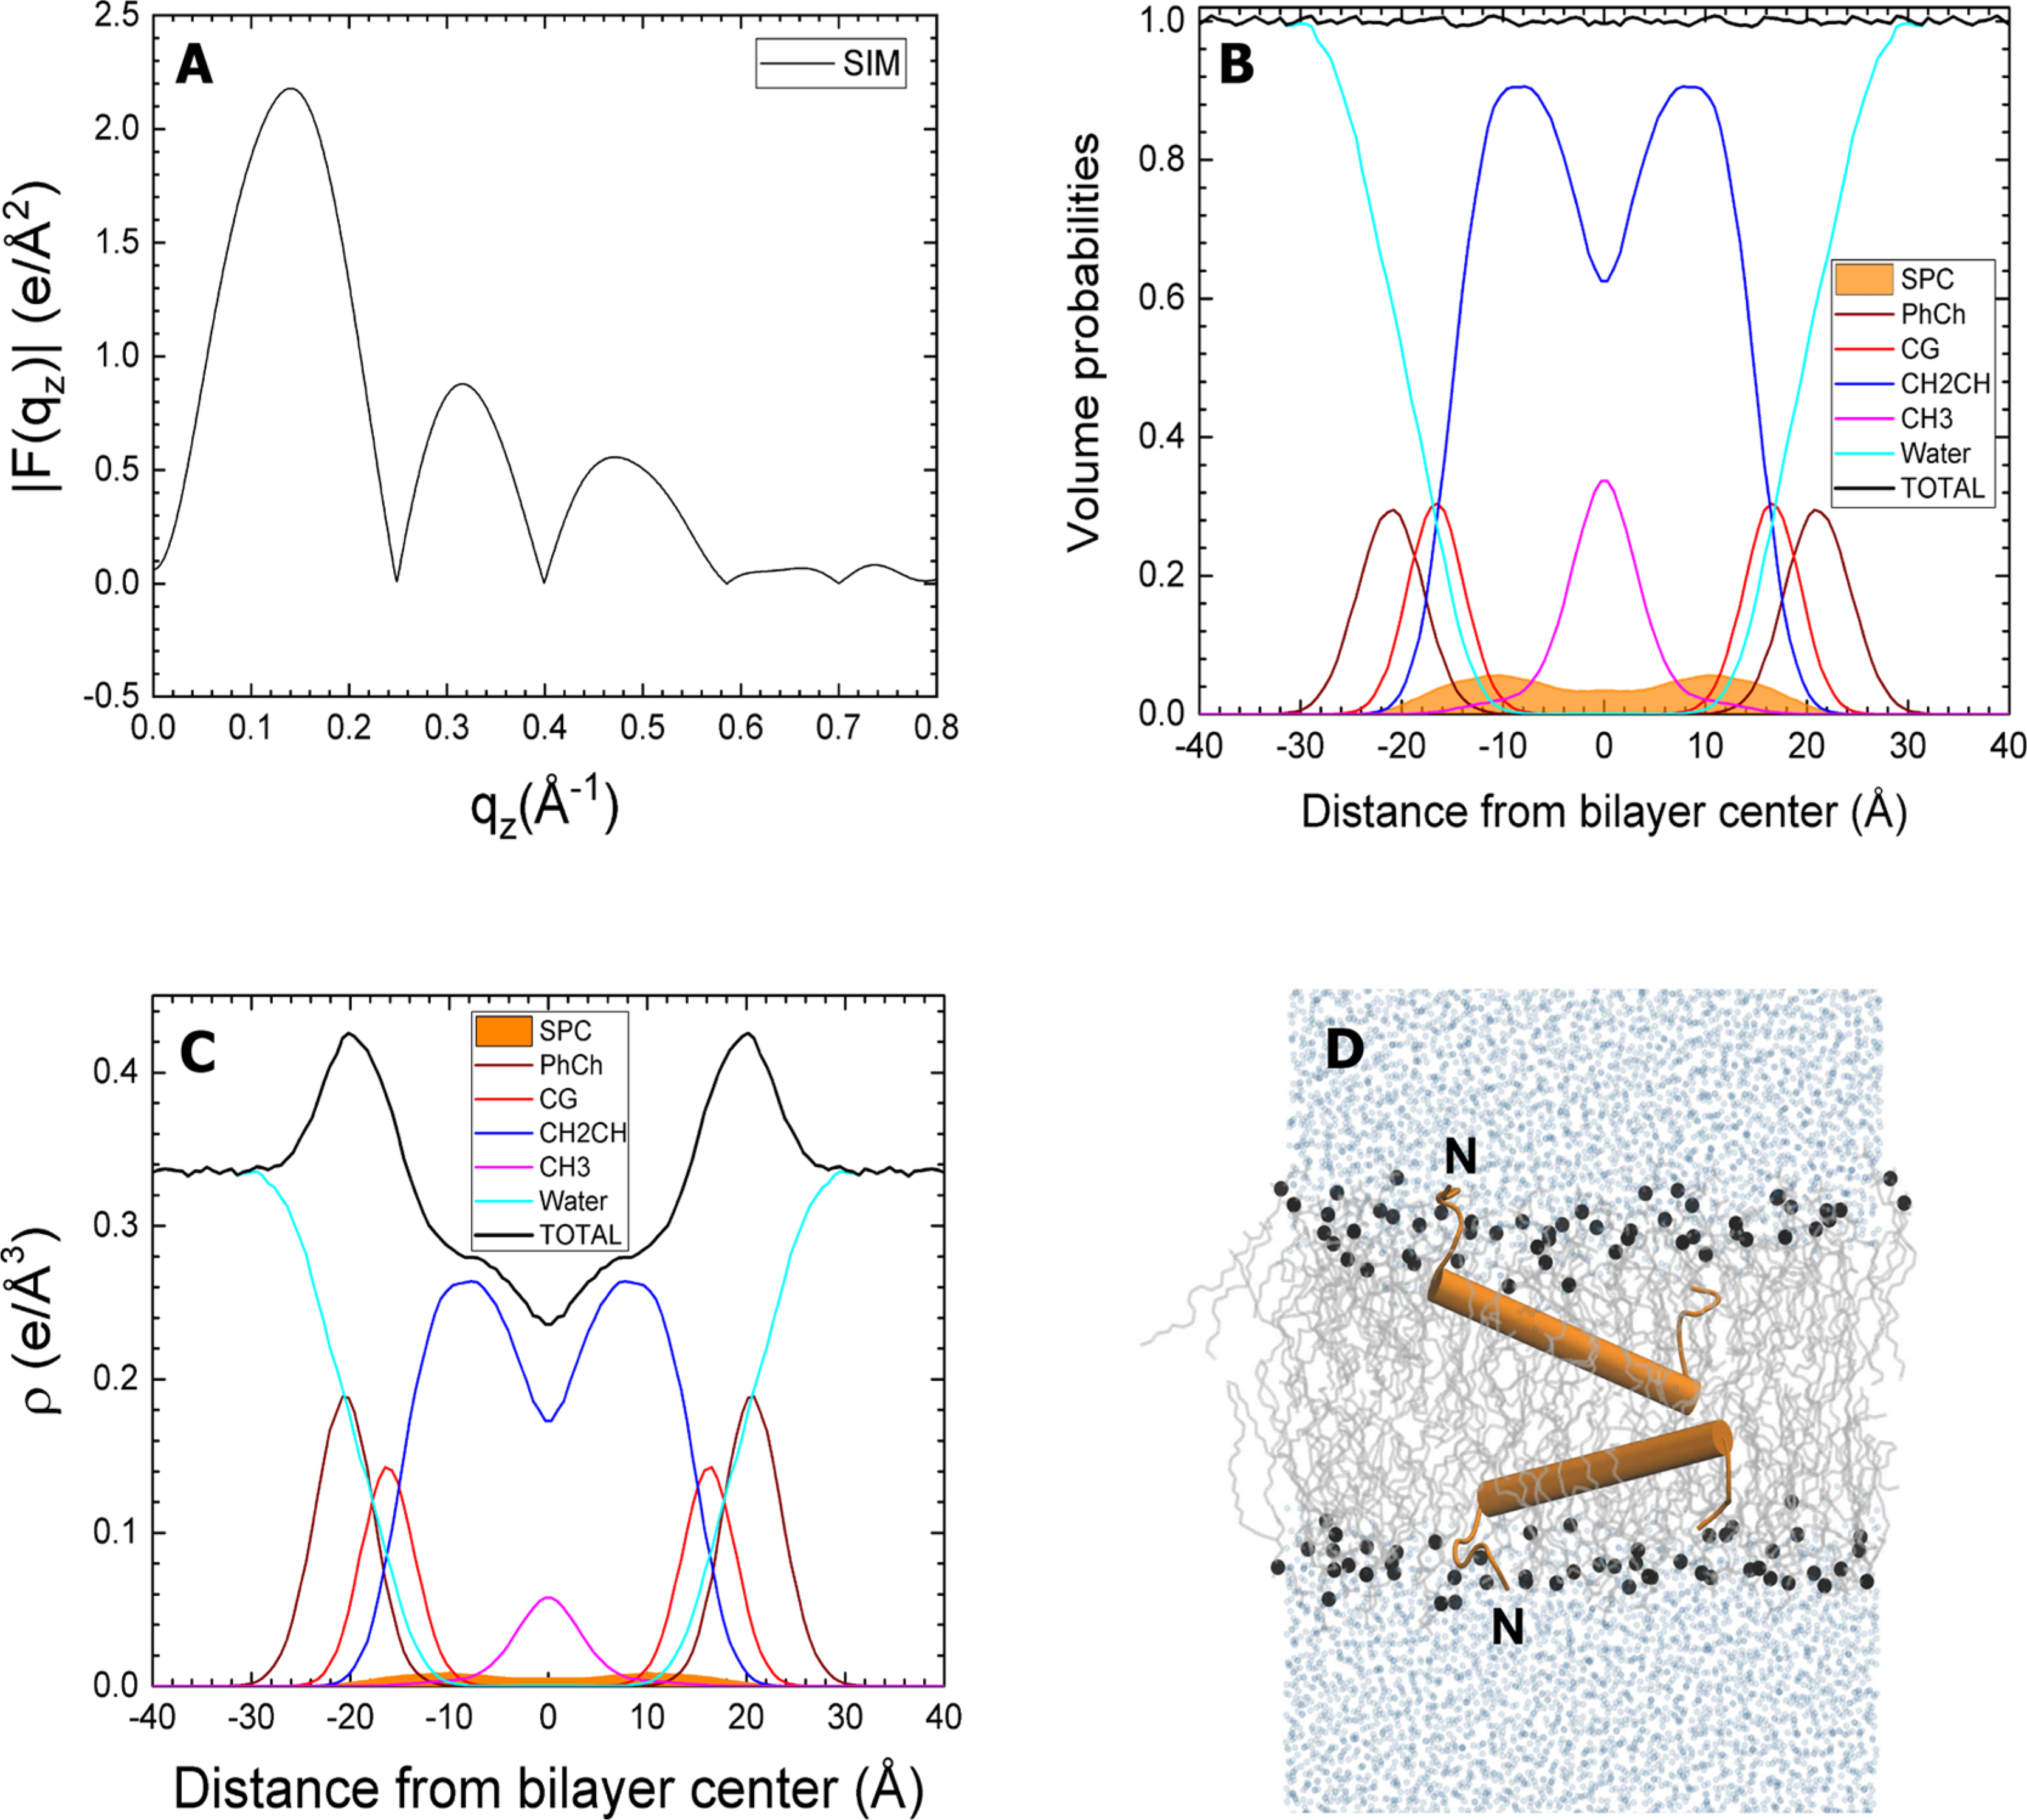
Figure 8.

Simulated SP-C:DOPC, with protein in the hydrocarbon region. The simulated SP-C:DOPC molar ratio is 1:80. Panels and component groups as in Figure 6. SP-C is shown in orange.“N” indicates the amino terminus of the peptide. Although not shown here, the simulations included the two palmitoyl residues.
