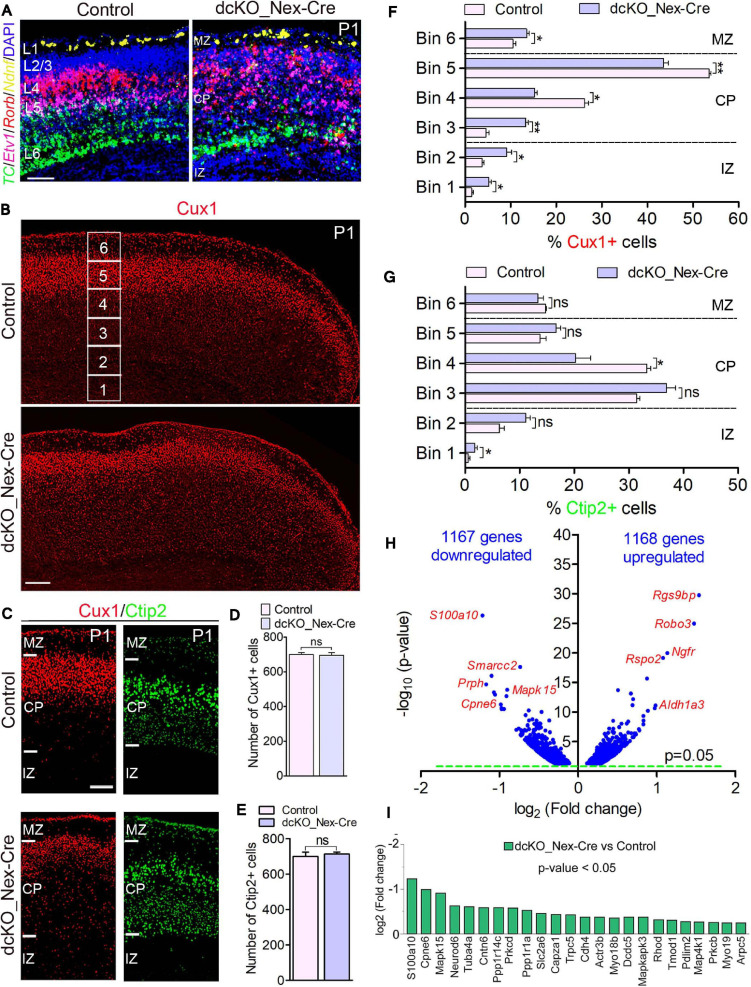
FIGURE 2.
Neuron-specific ablation of BAF complex causes downregulation of cell morphogenesis-related genes leading to delayed neuronal migration. (A) Micrographs showing fluorescence in situ hybridization in the P1 control and dcKO_Nex-Cre cortex stained with the layer-specific RNA probes TC1460681, Etv1, Rorb, and Ndnf to reveal cortical layers 6, 5, 4, and 1, respectively. (B) Overview micrographs showing immunostaining of the P1 control and dcKO_Nex-Cre cortex with Cux1 antibody to mainly mark cortical layer 2/3 neurons. Bins (1–6) for neuronal distribution analysis are indicated. (C) Micrographs with cortical regions indicated showing Cux1 and Ctip2 immunostaining of the P1 control and dcKO_Nex-Cre cortex. (D,E) Bar charts showing comparable number of Cux1+ (C) and Ctip2+ (D) neurons in the P1 control and dcKO_Nex-Cre cortical wall. (F,G) Bar graphs showing quantitative distribution (Bin analysis) of Cux1+ (F) and Ctip2+ (G) neurons in the P1 control and dcKO_Nex-Cre cortical wall. Quantified cortical area = (720 μm × 400 μm). (H) Volcano plot show genes downregulated and upregulated in the P1 dcKO_Nex-Cre cortex compared with control. Examples of top altered genes are shown. (I) Bar chart showing specific neuronal morphogenesis-related genes with reduced expression in the P1 dcKO_Nex-Cre cortex. Where shown, sections are counterstained with DAPI (blue). Unpaired Student’s t-test was used to test for statistical significance: *p < 0.01, **p < 0.001, ns, not significant; n = 6. Scale bar = 100 μm. Results are presented as mean ± SEM. IZ, intermediate zone; CP, cortical plate; MZ, marginal zone.

