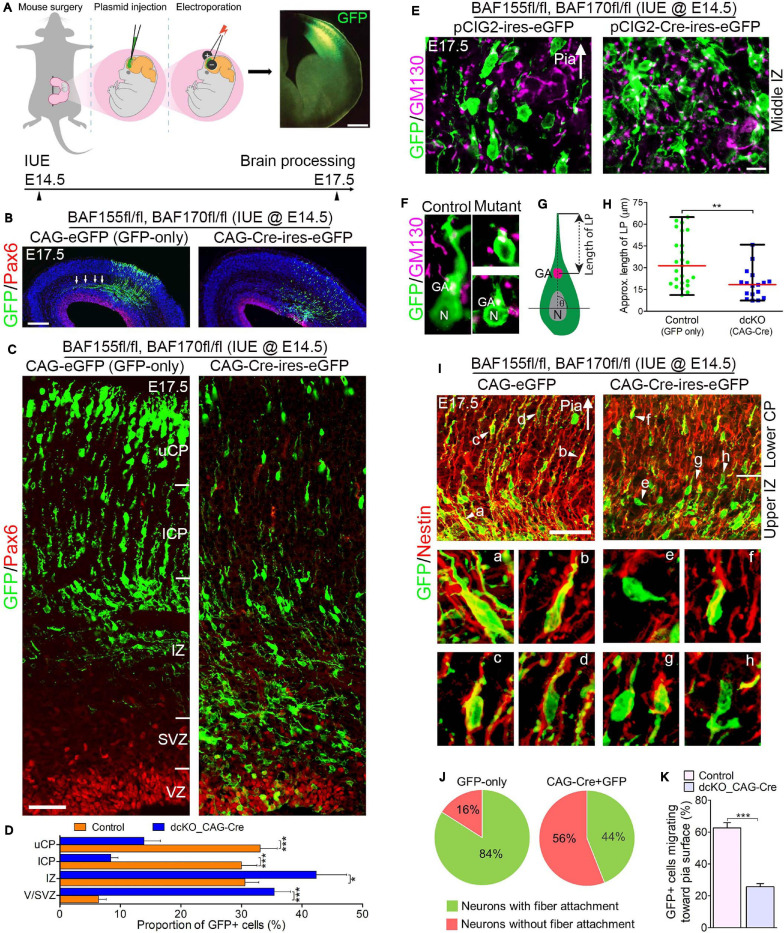
FIGURE 3.
Locomoting neurons without BAF complex exhibit abnormal polarity and radial direction mis-guidance. (A) Illustration of in utero electroporation technique used to achieve knockdown of BAF155 and BAF170. It shows a representative embryo in the uterine horn bearing double floxed BAF155 and BAF170 (BAF155fl/fl, BAF170fl/fl), and being injected in the brain with the plasmid of interest and electroporated at E14.5. Brain tissue was harvested at E17.5. A representative immunomicrograph showing GFP expression in E15.5 cortex is presented. (B) Immunohistochemical micrographs showing overview of Pax6 (to mark the germinal zone) and GFP staining in the E17.5 cortex (BAF155fl/fl, BAF170fl/fl) electroporated with control (GFP-only) or CAG-Cre + GFP plasmids. Arrows in control image point to outgrowth of axons. (C) Micrographs showing the electroporated cortical areas in (B) at higher magnification. Approximate cortical wall regions are shown. (D) Bar chart showing distribution of GFP+ cells (neurons) in the various cortical regions in the control and CAG-Cre + eGFP plasmid-injected E17.5 cortex. (E) Images showing the E17.5 control and mutant cortical middle intermediate zone with GFP and GM130 staining (Golgi apparatus marker). Arrow points in the direction of the pia surface. (F–H) Micrographs with GFP and GM130 staining (F) and illustration (G) showing estimation of the leading process (LP) length of control and BAF complex mutant cortical neurons in the lower cortical plate, which is graphically (statistically) compared in (H). (I) Images of the E17.5 control and mutant upper intermediate zone and lower cortical plate immunostained with GFP and Nestin antibodies to reveal neuron-glial fiber colocalization. Arrow heads (a–h) indicate examples of neurons migration with (a–d) or without/abnormally with (e–h) glial fiber guide. Arrow points in the direction of the pia surface. (J) Pie chart depicting the quantification of the proportion of GFP+ control and BAF complex mutant neurons migrating with or without glial fiber guide in the upper intermediate zone and lower cortical plate. (K) Bar chart showing the proportion of GFP+ neurons with their Golgi-leading process axis oriented toward the pia in (I). Arrows in (E,I) points in the direction of the pia surface. Where shown, sections are counterstained with DAPI (blue). Unpaired Student’s t-test was used to test for statistical significance: *p < 0.01, ***p < 0.0001; n = 4, selected in total 25 and 17 control and mutant GFP+ neurons in the upper IZ/lower CP region for leading process length estimation, respectively. Scale bars: =200 and 50 μm in overview and zoomed images, respectively. Results are presented as mean ± SEM or median and range. IUE, in utero electroporation; GA, Golgi apparatus; N, nucleus; VZ, ventricular zone; SVZ, subventricular zone; IZ, intermediate zone; l/uCP, lower/upper cortical plate; MZ, marginal zone.

