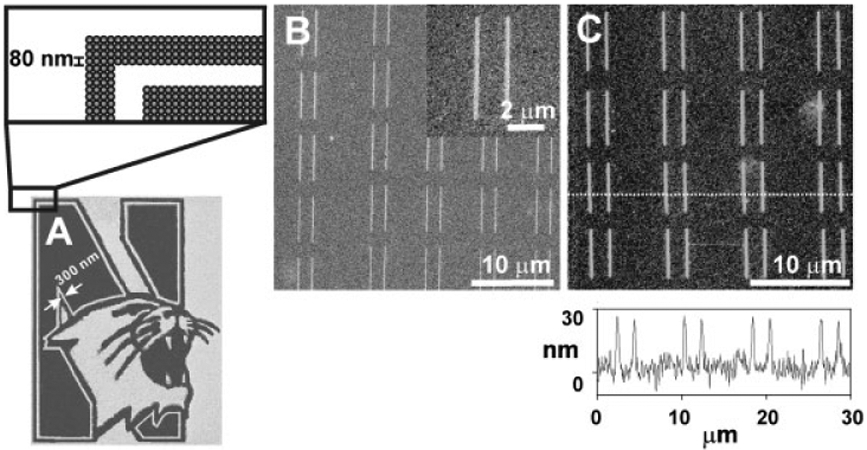
Figure 3.

A) SEM image of a set of positive nanostructures in the form of the Northwestern University logo; the expanded area is a representation of the dot matrix map used to generate the structure; B) SEM image of positive line structures generated by DPN with the PEG resist and subsequent wet chemical etching; C) tapping-mode AFM image of the nanostructures shown in (B) and its corresponding height profile.
