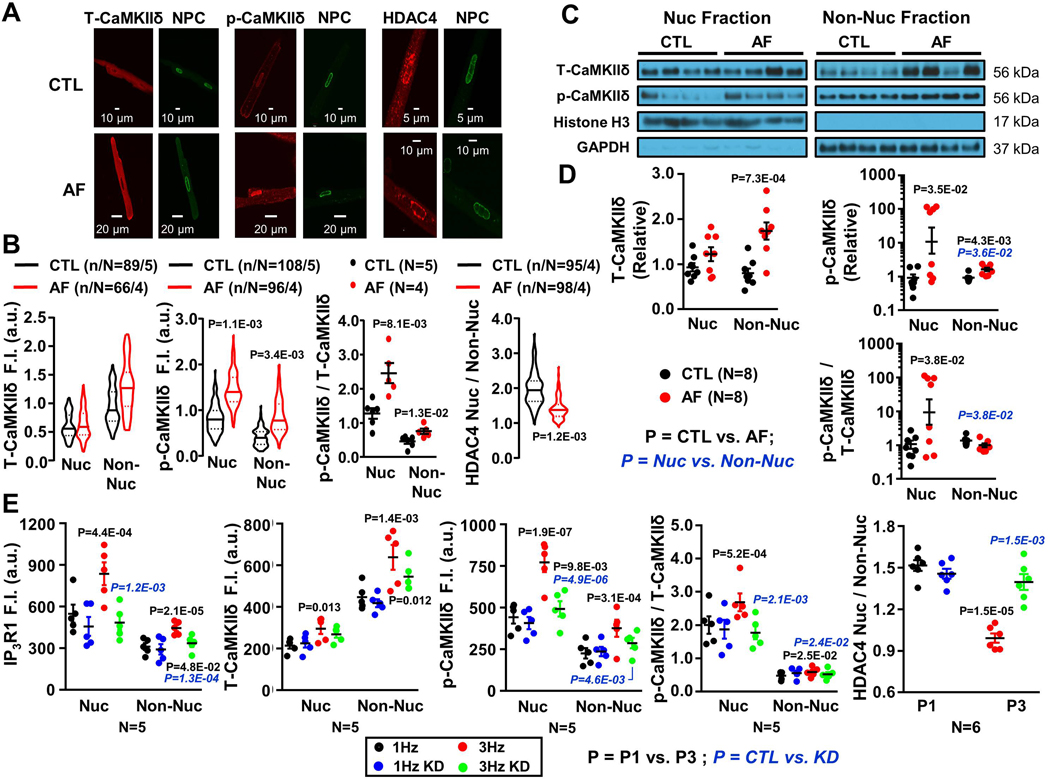
Figure 5.
A. Original 2-dimensional images from control (CTL) and atrial-fibrillation (AF) atrial cardiomyocytes (CMs) after immunostaining for NPC (green), T-CaMKIIδ, p-CaMKIIδ (Thr287) and HDAC4 (red). B. T-CaMKIIδ, p-CaMKIIδ and HDAC4 immunofluorescence quantification. C. Immunoblots for T-CaMKIIδ, p-CaMKII and HDAC4 from CTL and AF atrial CM nuclear (Nuc) and non-nuclear (Non-Nuc) fractions. D. Mean±SEM T-CaMKIIδ, p-CaMKIIδ and HDAC4 protein-expression levels. P-values in black reflect CTL vs. AF, P-values in blue reflect Nuc vs. Non-Nuc based on multilevel mixed effects models (B) or regular mixed effects models (D). E. Overall and individual-dog means for IP3R1, T-CaMKIIδ, p-CaMKIIδ and HDAC4 immunofluorescence intensity from P1 CMs and P3 CMs with or without ITPR1 knockdown (KD). P-values in black reflect P1 vs. P3, P-values in blue italics reflect with vs. without ITPR1 KD based on multilevel mixed effects models, using data from all CMs from each dog (as non-independent data points), with dog as the independent unit of analysis.

