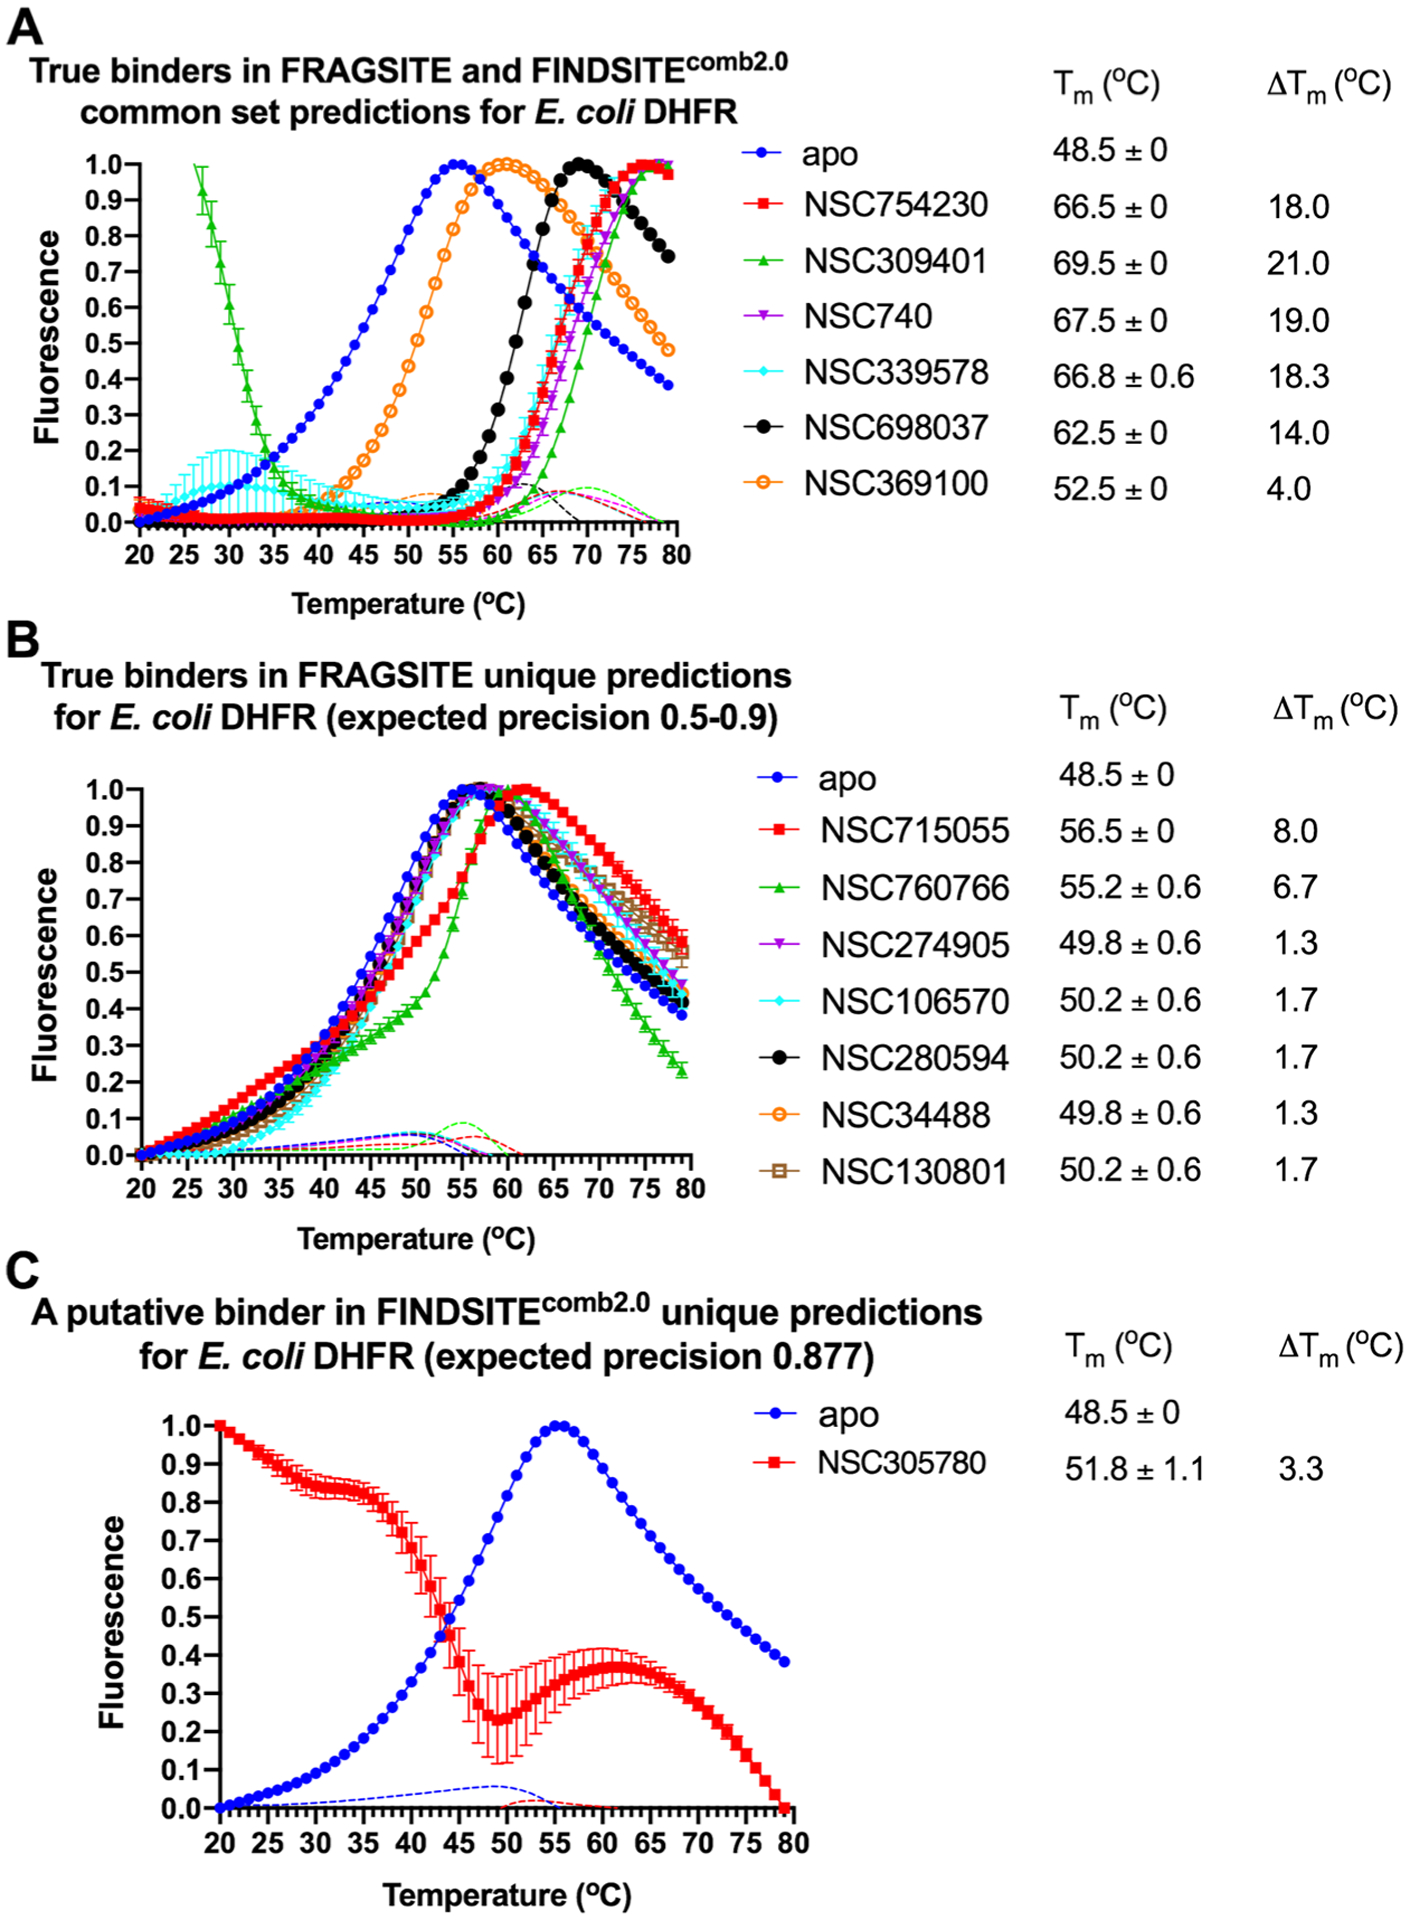
Figure 4.

(A–C) Thermal shift assay melting curves of E. coli DHFR with the top ranked drug binders predicted by FRAGSITE and FINDSITEcomb2.0 with an expected precision above 0.5. The slope of each curve is also plotted as dotted lines with the corresponding color coding. The final drug concentration is 500 μM. The reaction buffer contains 50 mM HEPES pH 7.3 and 100 mM NaCl. Each reaction condition has three replicates. ΔTm = Tm (protein with drug) − Tm (apo protein). See details in Methods.
