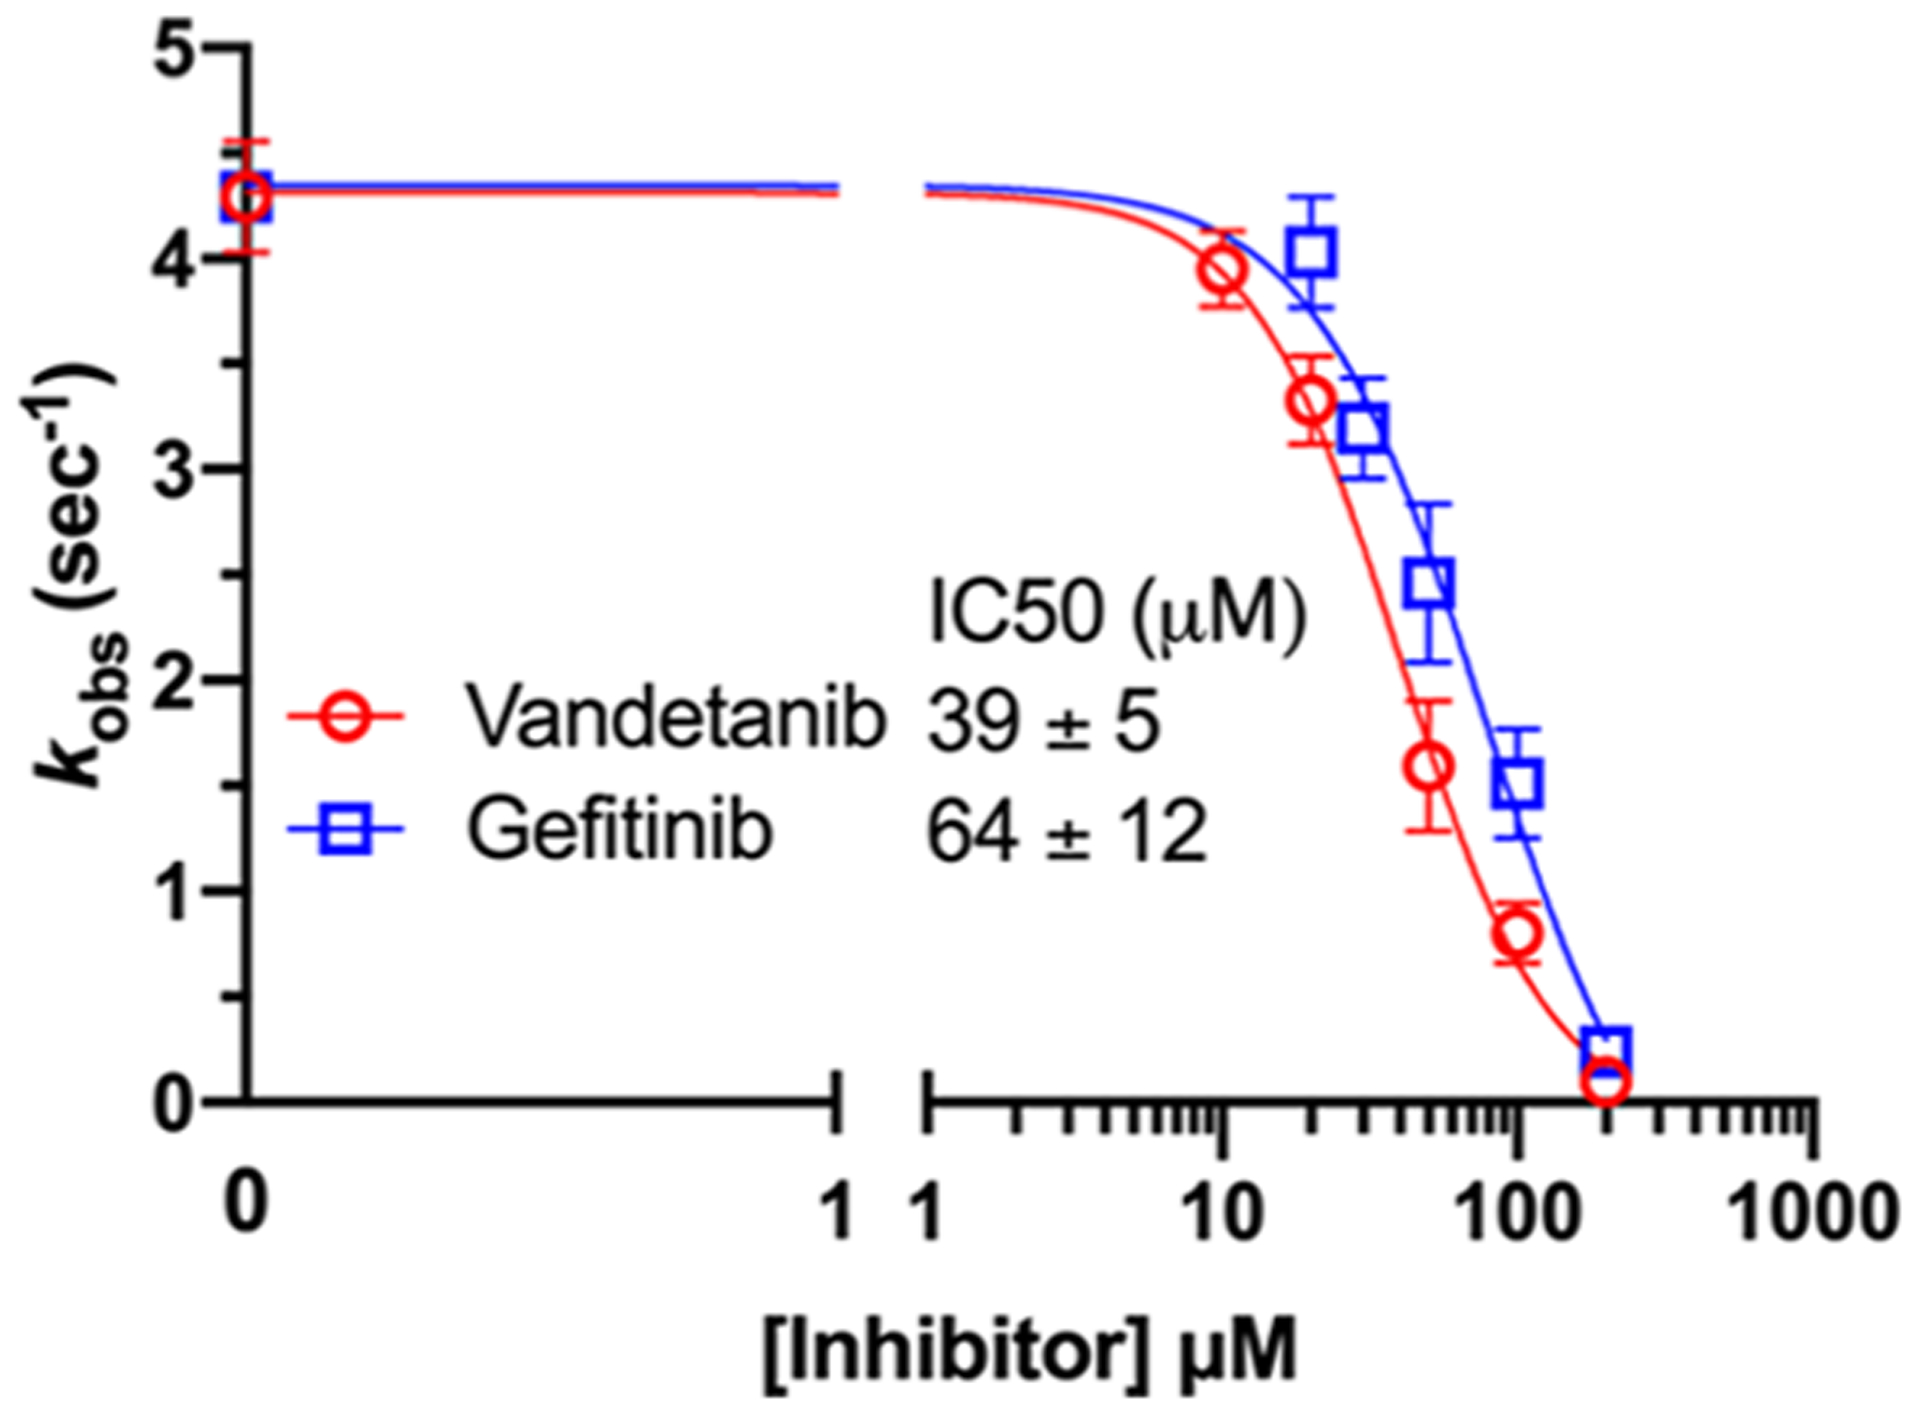
Figure 8.

Inhibitory dose response of E. coli DHFR steady-state kinetics to Vandetanib and Gefitinib. The reaction was performed under a constant room temperature of 18 °C under steady-state conditions with a catalytic amount of E. coli DHFR (93 nM) and saturated electron acceptor dihydrofolate (50 μM) and electron donor NADPH (100 μM) levels. The oxidation of NADPH was followed at 340 nm for 30–60 s. The observed initial linear rate was calculated using the published delta molar extinction coefficient Δε of 11.8 mM−1 cm−1.71 The reaction at each condition was replicated 3–4 times and is presented as the average value and standard deviation. Inhibitory dose response curve fitting was carried out using the “Absolute IC50” method of Prism software with the default setting and a baseline parameter value set to be 0, consistent with the control data of complete inhibition by Methotrexate and the current detection limit of kobs.
