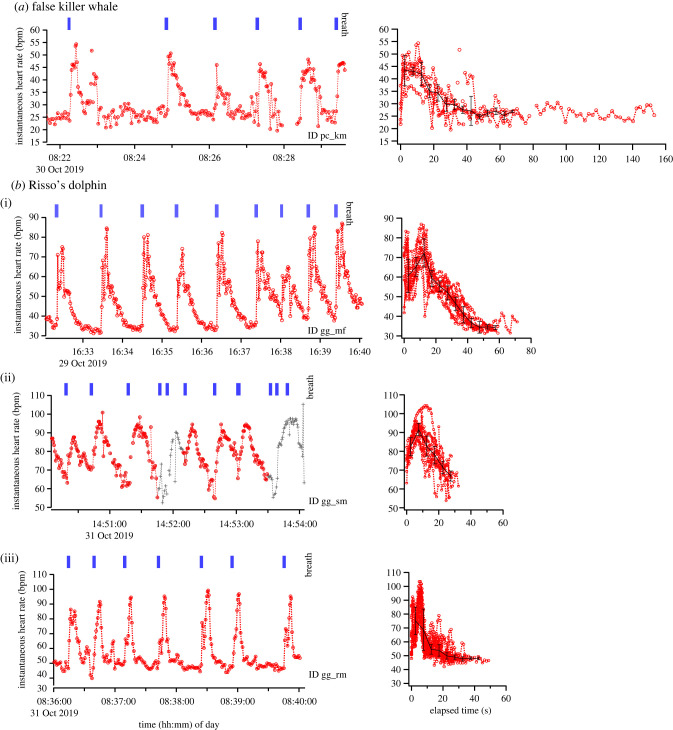
Figure 4.
Examples of variations in the instantaneous heart rates of two delphinid species with respiration (a) and (b). The red dashed lines and circles show pronounced sinus arrhythmia patterns associated with respiration. The grey dashed lines and crosses show less synchronized sinus arrhythmia patterns with respiration. The panels on the right show the changes in heart rate from the end of each respiration to the next respiration when pronounced sinus arrhythmia patterns were observed. The black lines and the error bars show the median and the quantile deviance at intervals of 5 s. We did not calculate the median and the quantile deviance after 70 s for ID pc_km, 60 s for ID gg_mf and 45 s for ID gg_rm because of few data points. (Online version in colour.)

