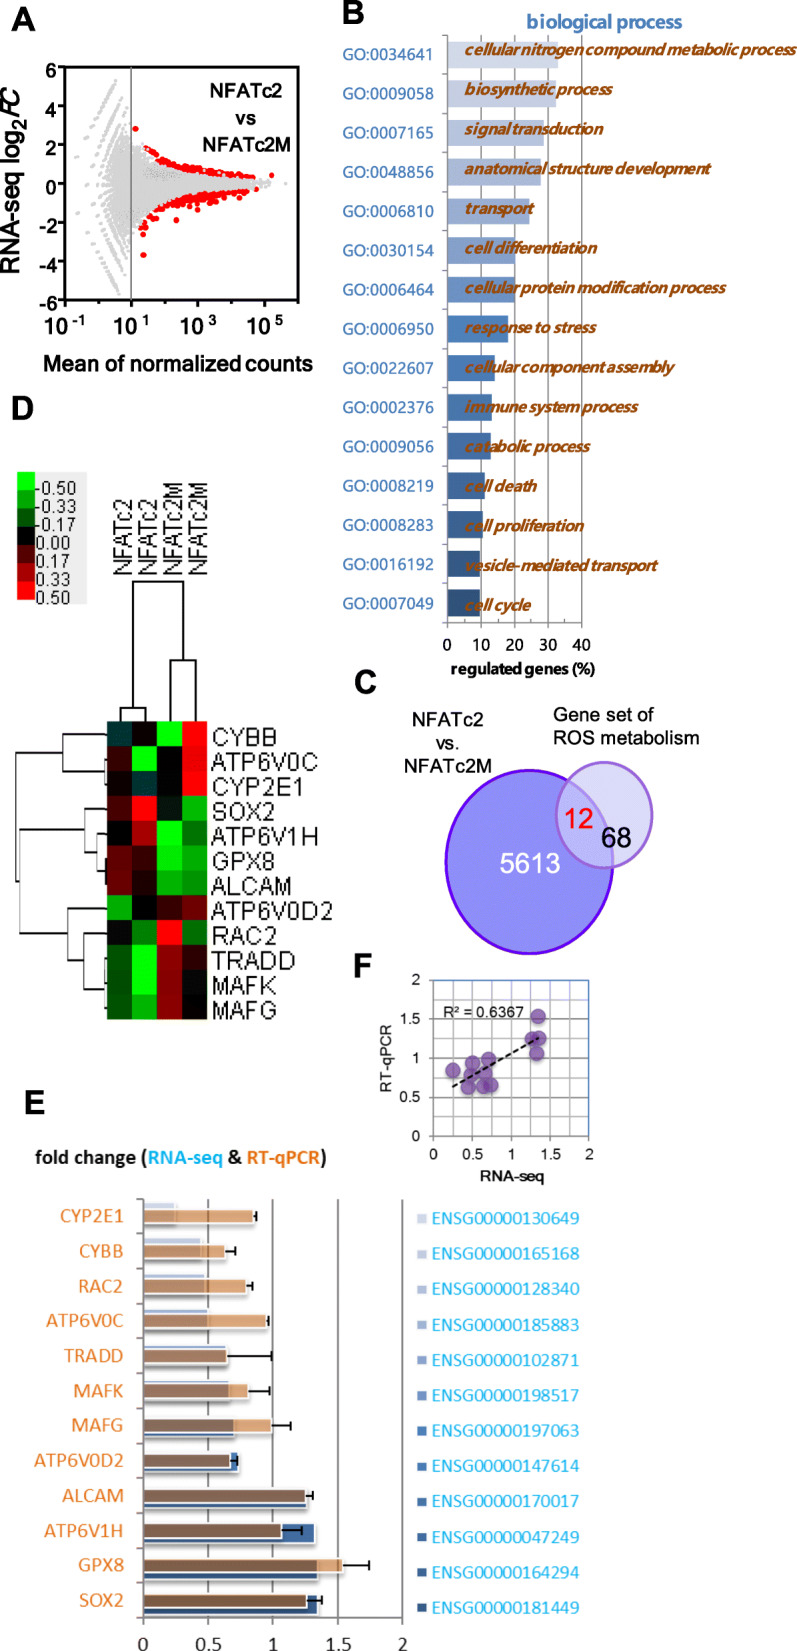
Fig. 4.

Transcriptome analysis of A549 cells transfected with NFATc2 or NFATc2M (loss of function mutant) and stimulated by OPNc-CM. a MA plot shows the log2-fold change (FC) value attributable to a given gene over the mean of normalized counts. Genes with the adjusted p value < 0.01 were highlighted in red. b Enriched Gene Ontology sets for differentially expressed (DE) genes. c Venn diagram illustrating the number of genes between DE genes with a most enriched gene set of ROS metabolism. d Heatmap representing the identified 12 DE genes of detected expression levels in hierarchical clusters. e Validation of the mRNA levels of selected DE genes by qRT-PCR (mean ± SEM. n = 3) and compared with RNA-seq counts. f Correlational analysis on RNA-seq and qRT-PCR results
