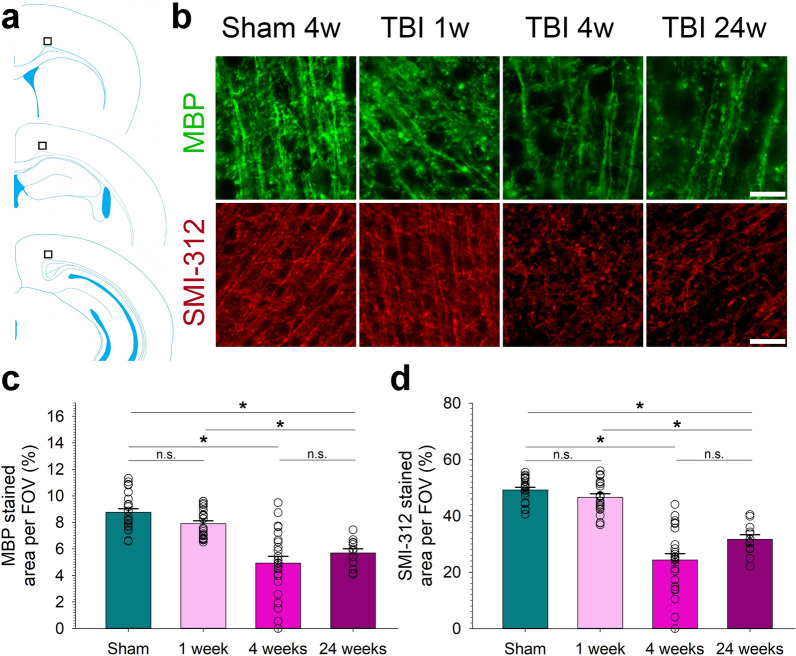
Fig. 5.
Axonal loss in cortex following repetitive traumatic brain injury (rTBI). (a) Cartoon depicting the 3 sections s1–s3 used for analysis. Black boxes indicate the location of the three fields of view (FOVs) used to quantify the immunofluorescent imaging signal for the myelin marker myelin basic protein (MBP) and the pan-axonal neurofilament marker SMI-312. (b) Representative photomicrographs showing progressive loss of the MBP and SMI-312 staining signal from 1 to 24 weeks after rTBI. Quantified staining signal for (c) MBP and (d) SMI-312. Data are mean ± SEM. n = 8 mice for sham, 1 week, and 4 weeks, n = 4 for 24 weeks. *P < 0.05. n.s. indicates not significant. All analyses were done using one-way ANOVA on Ranks with post-hoc Dunn's. Scale bar is 50 µm

