. 2021 May 31;3(13):3942–3953. doi: 10.1039/d1na00145k

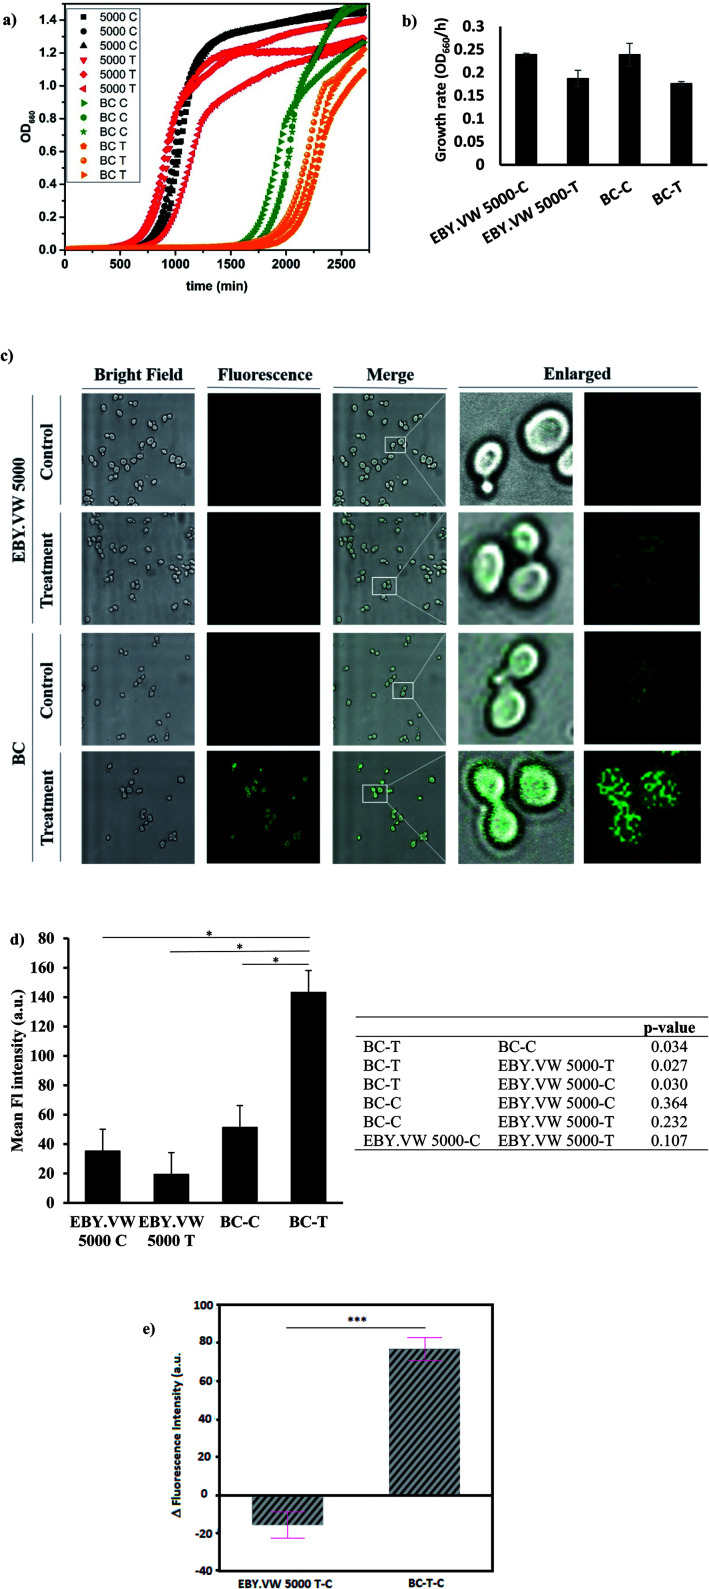
Fig. 4. (a) Growth curves of all groups in three replicates: black curves are EBY.VW 5000-C, red curves are EBY.VW 5000-T, green curves are BC-C and orange curves are BC-T (b) bar graph shows the mean growth rates (OD660/h) of EBY.VW 5000-C, EBY.VW 5000-T, BC-C and BC-T with standard error of the mean. Growth rates of treatment groups show no significant difference compared to respective controls (p > 0.05), (c) representative confocal images of EBY.VW 5000 and BC strains' control and treatment groups under bright field and fluorescence channels, merged images as well as enlarged images. Only BC-T shows bright fluorescence when treated with GluCDs, (d) bar graph shows the mean fluorescence intensity of all groups based on the quantitative fluorescence intensity analysis using confocal images. The table shows p-value for comparisons between each group. Fluorescence intensity of the treatment group of BC (Hex+) strain (BC-T) is significantly higher than that of all other groups (*p < 0.05) and there is no significant difference in the fluorescence intensity between other groups. (e) Delta fluorescence intensity of treatment groups of BC-T-C (Hex+) and EBY.VW 5000-T-C (Hex−) strains after subtracting the corresponding autofluorescence, ***p value < 0.0005.

Fig. 4