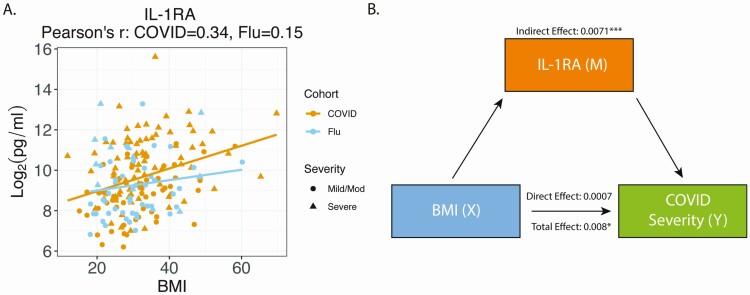
Figure 4.
Mediation analysis of BMI and IL-1RA on COVID-19 severity. A, BMI (X axis) was plotted versus IL-1RA level (Y axis). The yellow line is a linear regression line for the COVID-19 cohort and the blue line is a linear regression line for the influenza cohort. The Pearson’s correlation coefficient between IL-1RA and BMI is 0.34 for the COVID-19 cohort and 0.15 for the influenza cohort. B, Diagram of the mediation analysis of BMI and IL-1RA on COVID-19 severity while controlling for diabetes and heart disease. The indirect, direct, and total effects were showed in the diagram. Statistical significance is indicated by *, **, or *** representing FDR <0.25, <0.1, or <0.05, respectively. Abbreviations: BMI, body mass index; COVID-19, coronavirus disease 2019; FDR, false discovery rate; IL, interleukin.

