Fig. 3.
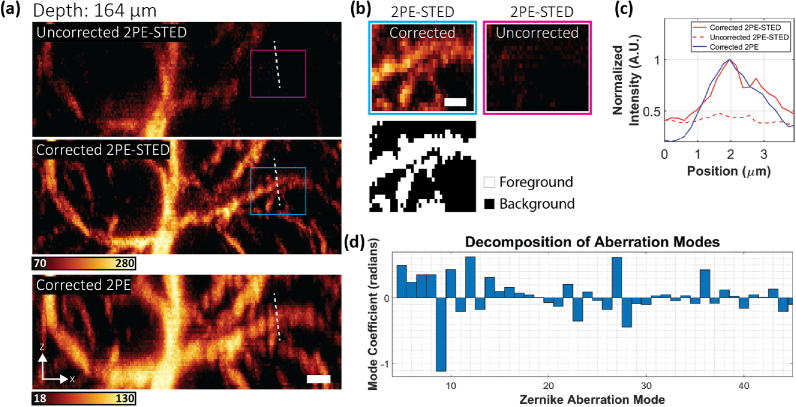
Aberration-corrected 2PE-STED microscopy in fixed mouse brain tissue. (a) MIP of uncorrected 2PE-STED (top), corrected 2PE-STED (middle), and corrected 2PE (bottom) image stacks (unsmoothed) of ATTO594-labelled astrocytes, resliced in the direction. The center of the image stack was 164 µm below the tissue surface. Scale bar: 2 µm. (b) Top: Areas corresponding to the magenta and cyan boxes in (a) showing an -fold increase in foreground intensity between the uncorrected and corrected images. Bottom: Mask used to delineate the foreground and background pixels. The mask was generated using the Otsu method. The intensity of each image was calculated as the mean of the foreground pixels minus the mean of the background pixels. Scale bar: 1 µm (c) Plot of the intensity profiles at the positions marked by the white dashed lines in (a). The solid red line corresponds to the corrected 2PE-STED image. The dashed line corresponds to the uncorrected 2PE-STED image. The solid blue line corresponds to the corrected 2PE image. The profiles were acquired from a sum intensity projection of the raw, unsmoothed data. (d) Zernike mode decomposition of the DM correction applied for acquiring the corrected image stacks in (a).

