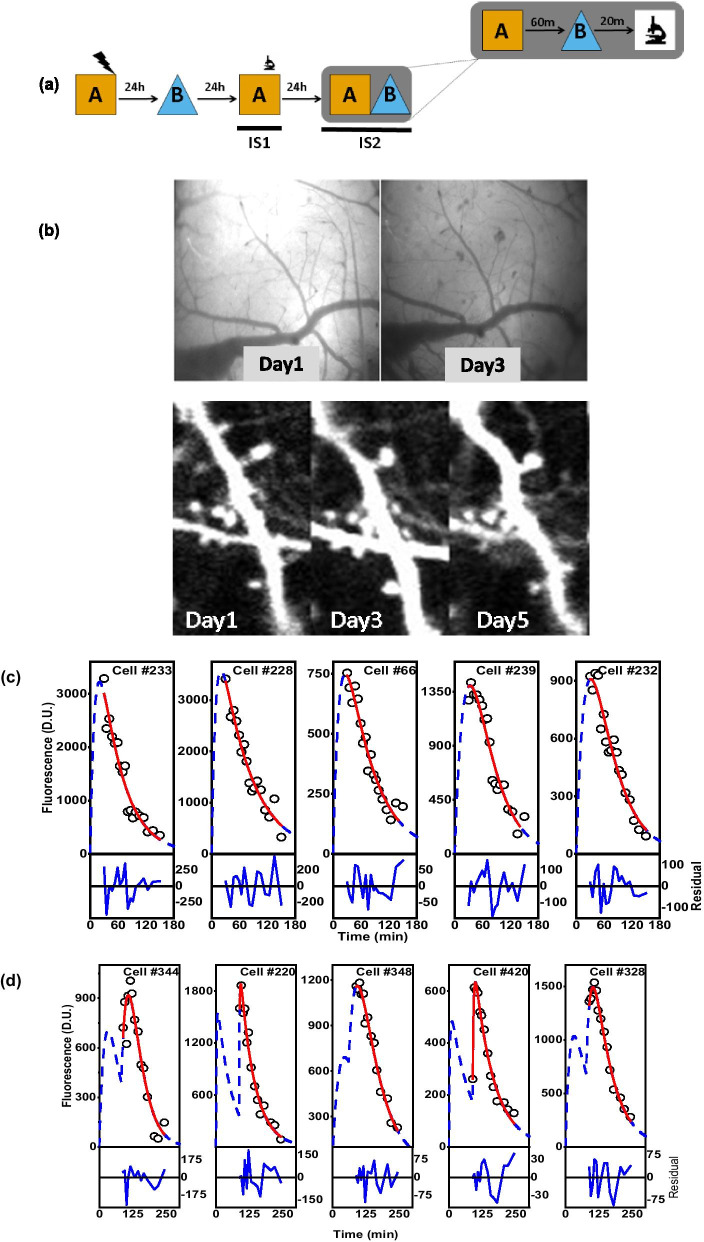
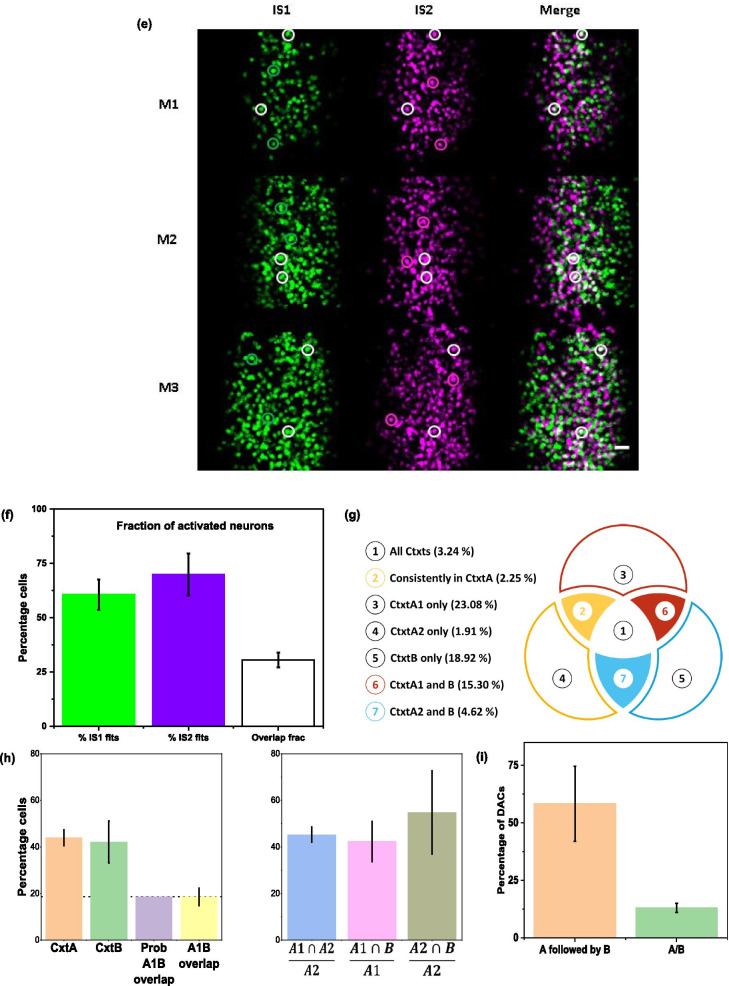
Fig. 5.
Identification and segregation of neuronal ensembles based on cfos protein temporal expression dynamics. a Schematic of behavioural paradigm used. b Longitudinal in vivo imaging of the same area across multiple days is achieved by using the unique blood vasculature of craniotomized mice. The representative images show the precision with which dendrites and their spines can be imaged across multiple days (1–5 days) in Thy1-YFP transgenic mice. The same method was followed for longitudinal in vivo imaging of cfos transgenic mice. c Representative plots of expression profile of single activation neurons. d Representative plots of expression profile of double activation neurons. The response of the neurons(DAC) fit (red line) is explained better by DAC profile Eq. 2 rather than SAC profile Eq. 1. The dashed blue line shows the fit spanning the entire laboratory time frame of t = 0 min where the mouse was exposed to the first context A, followed by t = 60 min where the mouse was exposed to context B. e Representative snapshot of cfos neuronal ensembles at ~ 90 min on imaging sessions IS1 (green) and IS2 (magenta) with overlapping ensembles shown in white. We constructed these images from snapshots of the RSc at ~ 90 min after the first context exposure of the imaging session. f Fraction of activated neurons on days IS1, IS2 and their overlap. g Visual schematic representing different categories of cells representing context information. The circles in the diagram represent the cellular ensemble that got activated in IS1(red), IS2(yellow) and IS2-60 min(blue). h Fraction of activated neurons on different retrieval events. Different bars on the left represent activated neurons (SAC or DAC) in response to different ctxt exposure—Orange: CtxtA on IS1, Green: CtxtB on IS2, Purple: chance factor determined as a product of CtxtA and CtxtB fractional activation., Yellow: observed overlap of CtxtA IS1 and CtxtB IS2 activation. The bars on the right side show the fractional activation to determine the overlap among/across the context with respect to CtxtA exposure in IS2. The blue bar represents the fraction of the cells that are part of CtxtA IS2 and are also part of CtxtA IS1. We estimate this fraction as this is independent of the activation across days. The pink bar represents the fraction of cells that are activated in CtxtA IS1and CtxtB IS2, while the grey bar represents the fraction of CtxtA IS2 cells that are active during CtxtB IS2. i The fraction of double activation cells in response to CtxtA followed by CtxtB on IS2 is significantly more than the fraction of double activation cells in response to single context exposure event


