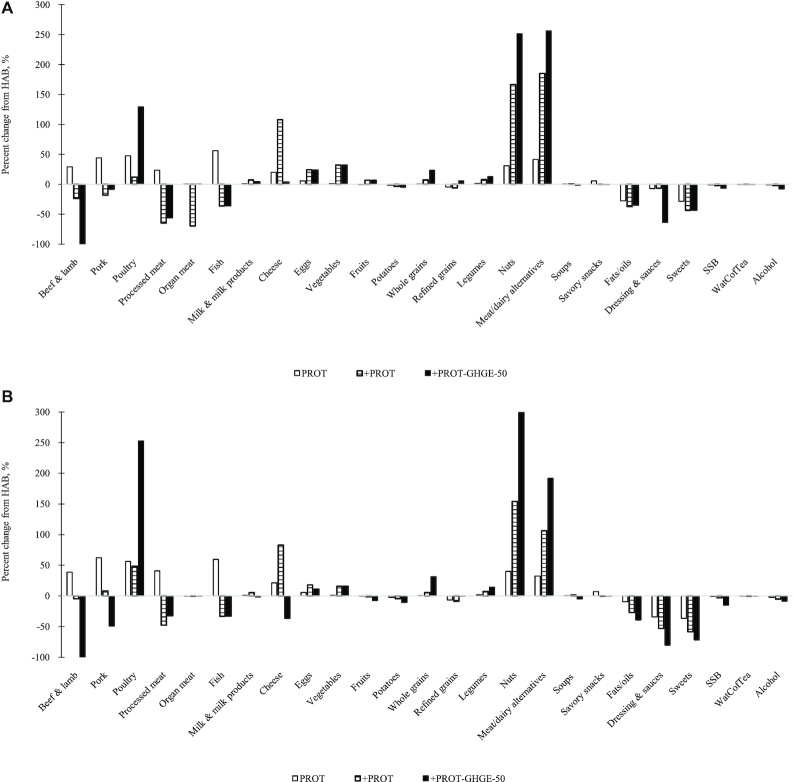
FIGURE 1.
Percentage change in food group quantities from HAB to PROT, +PROT, and +PROT-GHGE-50 in Dutch men (A, n = 644) and women (B, n = 710) aged 56–101 y. GHGE, greenhouse gas emission; HAB, habitual diet; PROT, high-protein diet; +PROT, high-protein diet aligned with the Dutch food-based dietary guidelines; +PROT-GHGE-50, high-protein diet aligned with the Dutch food-based dietary guidelines with 50% GHGE reduction; SSB, sugar-sweetened beverages; WatCofTea, water, coffee, tea.

