Fig. 3.
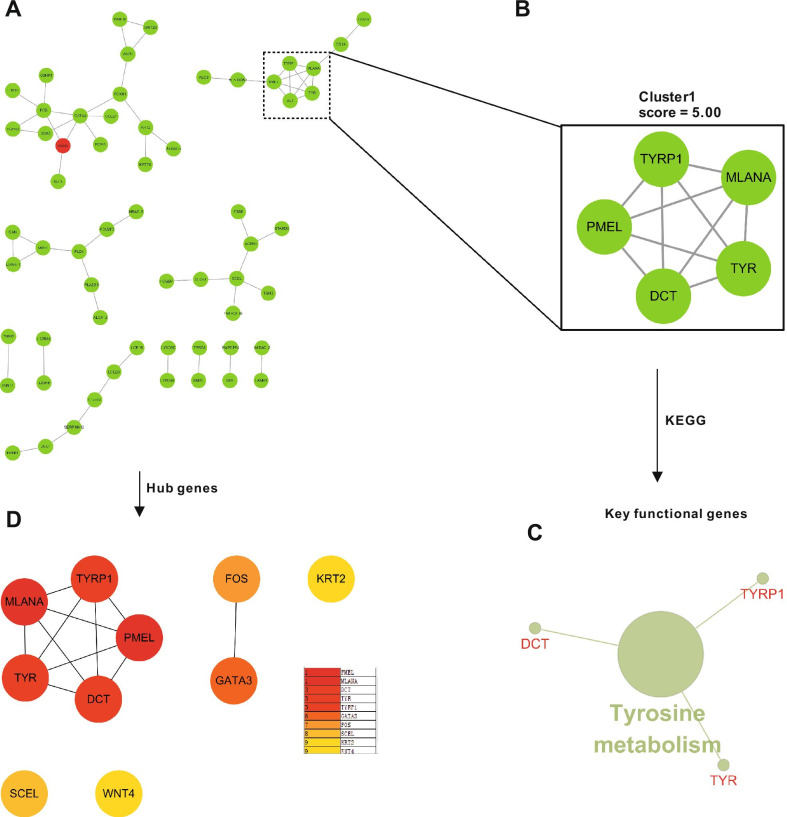
Hub clusters of DEGs in the acute wound phase analyzed by protein–protein interaction (PPI) analysis and hub genes related to KEGG pathway enrichment. A PPI interaction network. Green nodes represent downregulated genes; red nodes represent upregulated genes. B PPI molecular complex detection method (MCODE) component. The highest scoring module identified from the PPI network using the MCODE algorithm with a score of 5.00, with five key genes involved. C Key genes in cluster 1 were annotated in the context of the KEGG database by ClueGO, of which 3 (TYR, TYRP1, and DCT) were enriched in the tyrosine metabolism pathway, and defined as key functional genes. D The top 10 hub genes in the PPI were screened by Cytoscape plugin cytoHubba based on their connectivity degree

