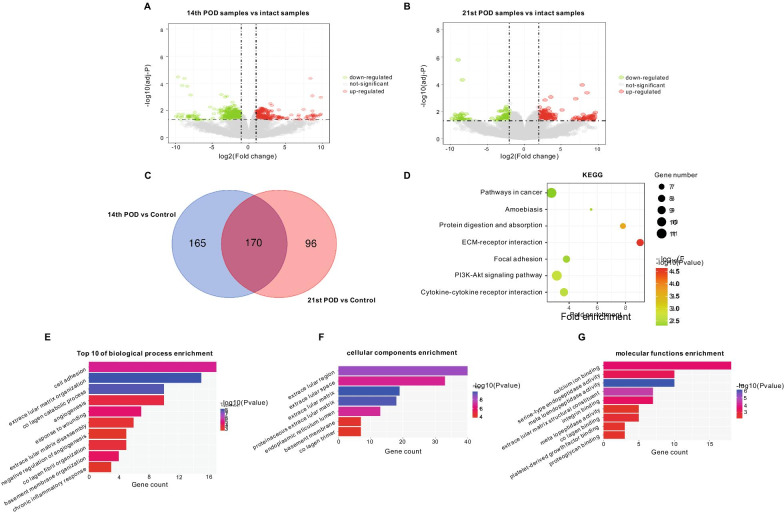
Fig. 6.
Differentially expressed genes (DEGs) in the remodeling phase, and Gene Ontology (GO) and KEGG pathway analysis of DEGs. A Volcano plot representing DEGs on the fourteenth-postoperative-day (14th POD) compared with intact skin (control). B Volcano plot representing DEGs on the twenty first-postoperative-day (21st POD) compared with the control. C Venn diagram displaying significantly differentially expressed overlapping genes on the 14th and 21st POD compared with the control. D The most significantly enriched KEGG pathways and numbers of genes involved; E Ten most significantly enriched GO terms for biological processes and numbers of genes involved; F The most significantly enriched GO terms for cellular components and numbers of genes involved; G The most significantly enriched GO terms for molecular function of DEGs and numbers of genes involved in the overlapping genes that were significantly differentially expressed on the 14th and 21st POD compared with control. P < 0.01 defined as significantly enriched

