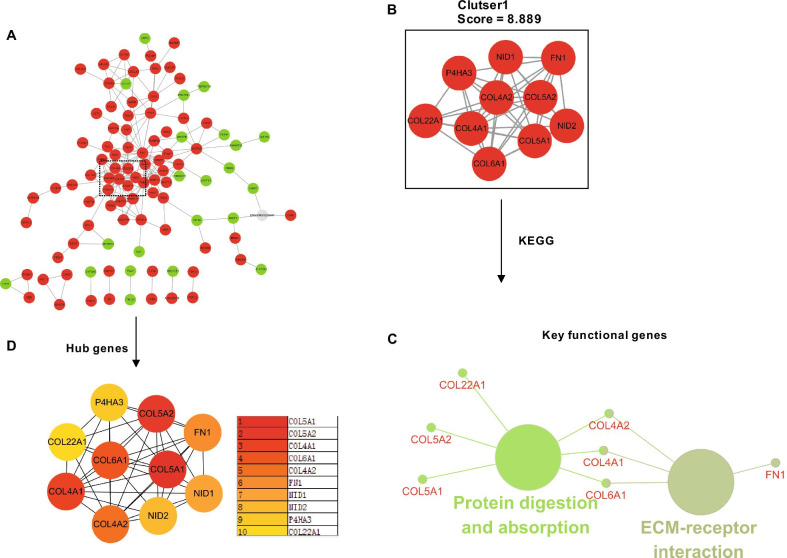
Fig. 7.
Hub clusters of DEGs in the remodeling phase analyzed by protein–protein interactions (PPI) and hub genes related to KEGG pathway enrichment. A PPI interaction network. Green nodes represent downregulated genes; red nodes represent upregulated genes. B PPI molecular complex detection method (MCODE) component. Highest scoring module identified from the PPI network using the MCODE algorithm with a score of 8.889 (cluster 1), with five key genes involved. C Key genes in the cluster were annotated in the context of the KEGG database and the relationships between these annotated terms were calculated and grouped using ClueGO to create an annotation module network. Genes with connections to more than two terms were defined as hub genes. D The top 10 hub genes in the PPI were screened by Cytoscape plugin cytoHubba based on their connectivity degree

