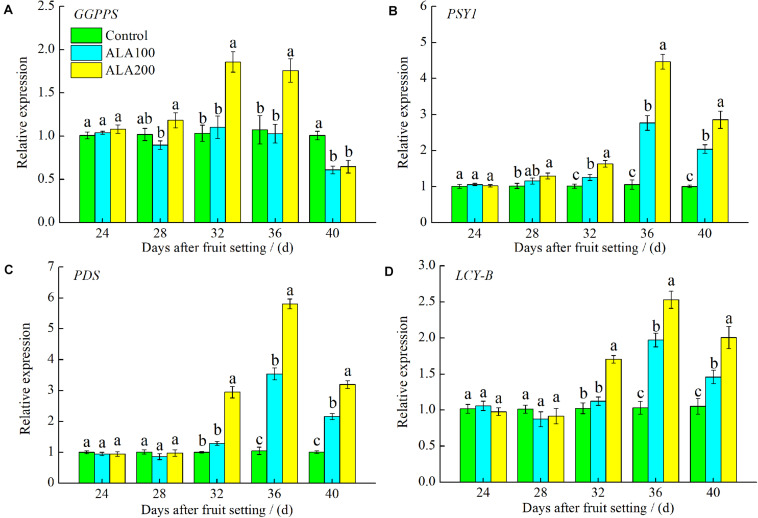
FIGURE 5.
Relative expression levels of key genes involved in lycopene synthesis and metabolism pathway. (A) Relative expression of GGPPS, encoding geranylgeranyl diphosphate synthase; (B) relative expression of PSY1, encoding phytoene synthase; (C) relative expression of PDS, encoding phytoene desaturase; and (D) relative expression of LCY-B, encoding lycopene β-cyclase. Vertical bars represent mean ± SE from three independent replicates and the different letters denote significant differences (p < 0.05). The control group was used as reference at each sampling time point.

