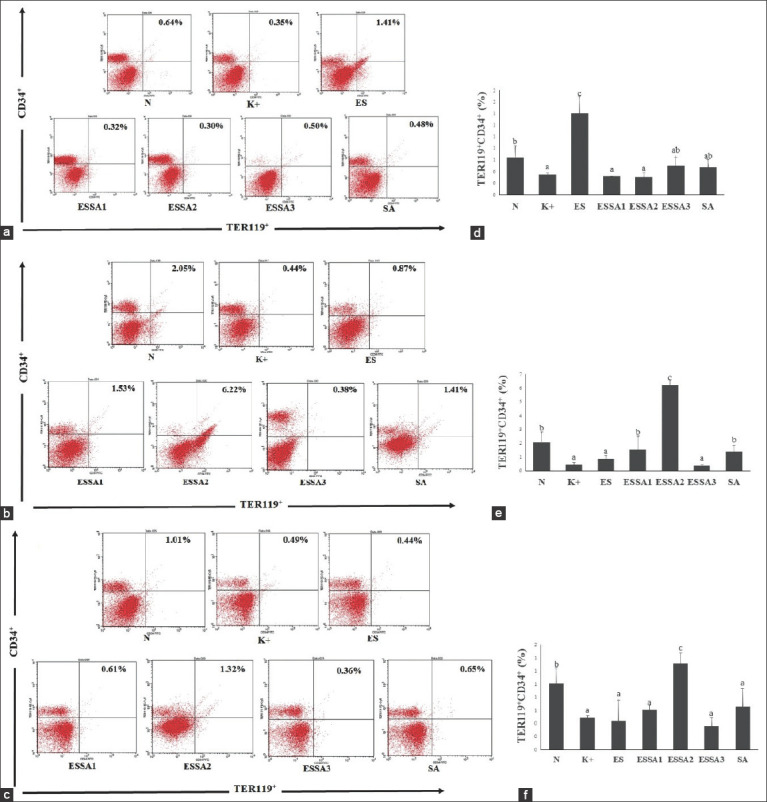
Figure-2.

Flow cytometry of isolated bone marrow labeled with TER-119+CD34+ post-Escherichia coli challenge. (a-c) Representative FACS dot plots showing the percentage of TER-119+CD34+ in all groups treatment on day-8, 12, and 16, respectively. (d-f) The bars are a calculation of the relative number TER-119+CD34+ expression on day-8, 12, and 16, respectively. The results were expressed as the mean±SD. Different superscript letters indicate statistical significance (p<0.05). Note: Healthy pregnant mice were not subjected to E. coli infection (N), pregnant mice infected with E. coli (K+), pregnant mice infected with E. coli and treated with 200 mg/kg of ES (ES), pregnant mice infected with E. coli and treated with combined 150 mg/kg ES and 37.5 mg/kg SA (75% ES:25% SA), 100 mg/kg ES and 75 mg/kg SA (50% ES:50% SA), and 50 mg/kg ES and 112.5 mg/kg SA (25% ES:75% SA) (ESSA1, ESSA2, and ESSA3, respectively), and pregnant mice infected with E. coli and treated with 150 mg/kg SA (SA).
