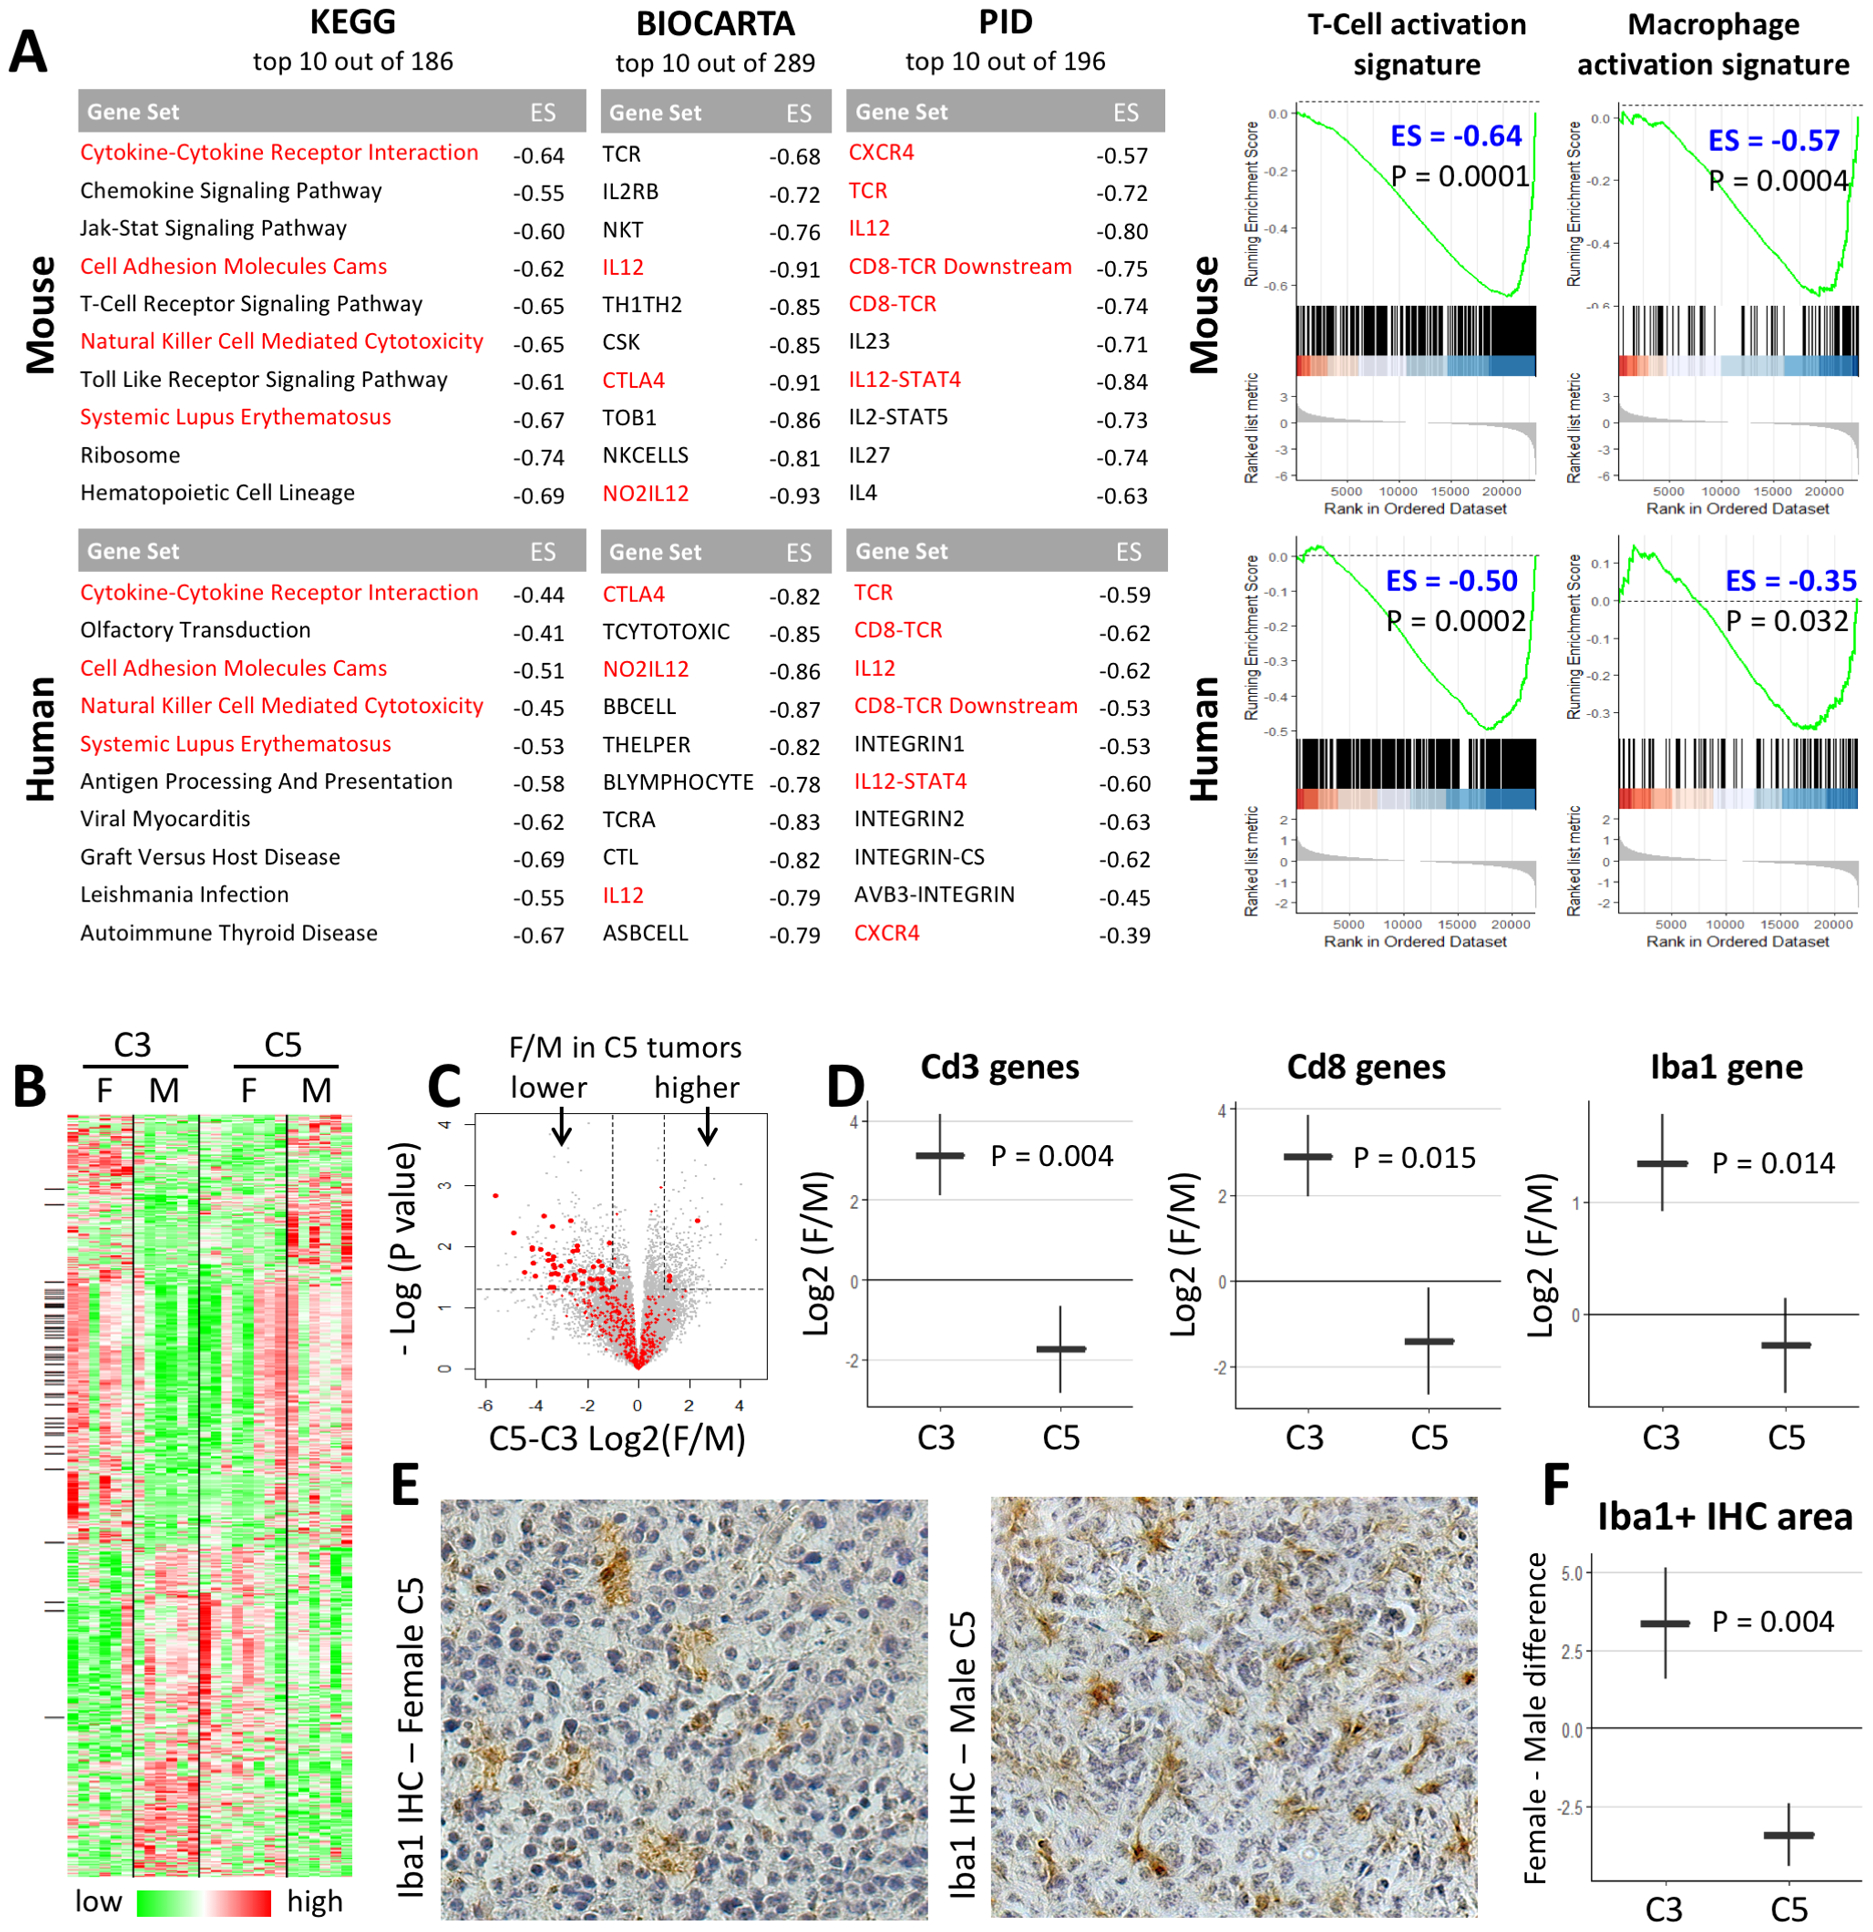
Figure 5. POT1 depletion has sex-dependent effects on glioma immune infiltration.

(A) Top 10 GSEA-ranked gene sets with sex-tumor interaction. Negative Enrichment Score (ES<0) signifies a lower female/male enrichment in POT1-depleted tumors. Red font denotes occurrence on both mouse and human lists. All adjusted P values <0.01. GSEA plots demonstrate POT1 depletion in mouse and human glioma results in similar sex-dependent changes (ES<0) in T-Cell and Macrophage activation signatures. (B) Heatmap of Log2(expression) values for top genes with sex-tumor interaction. Black marks on the left side denote genes in T-Cell or Macrophage gene sets. (C) Volcano plot for sex-tumor interaction. Marked in red are genes in T-Cell and Macrophage gene sets which show a clear deviation to the left side of the plot. Larger red dots denote top genes which also have a black mark in C. (D) Markers of T-lymphocytes (Cd3 and Cd8) and macrophages/microglia (Iba1) show similar sex-dependent changes at the RNA level. (E–F) Iba1 IHC demonstrates sex-dependent changes in microglia/macrophage infiltration similar to those seen at the RNA level. Plots in E and G show mean ± standard error. C3 tumors contain knockouts of Trp53, Nf1, and Pten. C5 tumors contain additional knockouts of Pot1a and Pot1b.
