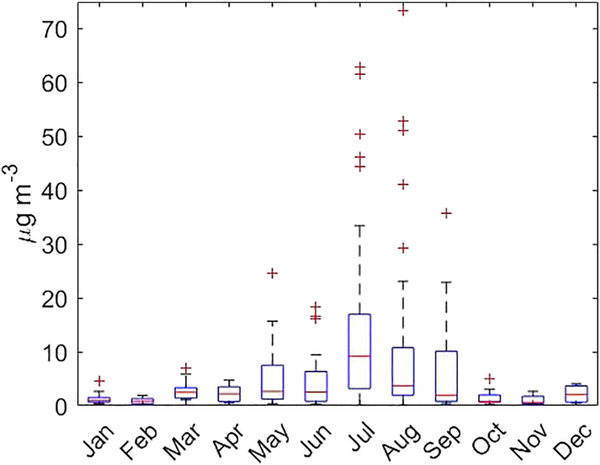
Fig. 2.
Monthly statistics of the African dust mass concentrations measured at the CAROb station in 2013, 2017, and 2018. The red line in the center of each box represents the median, the edges of each box indicate the 25th and 75th quartiles, and red crosses belong to outliers lying in the fourth quartile.

