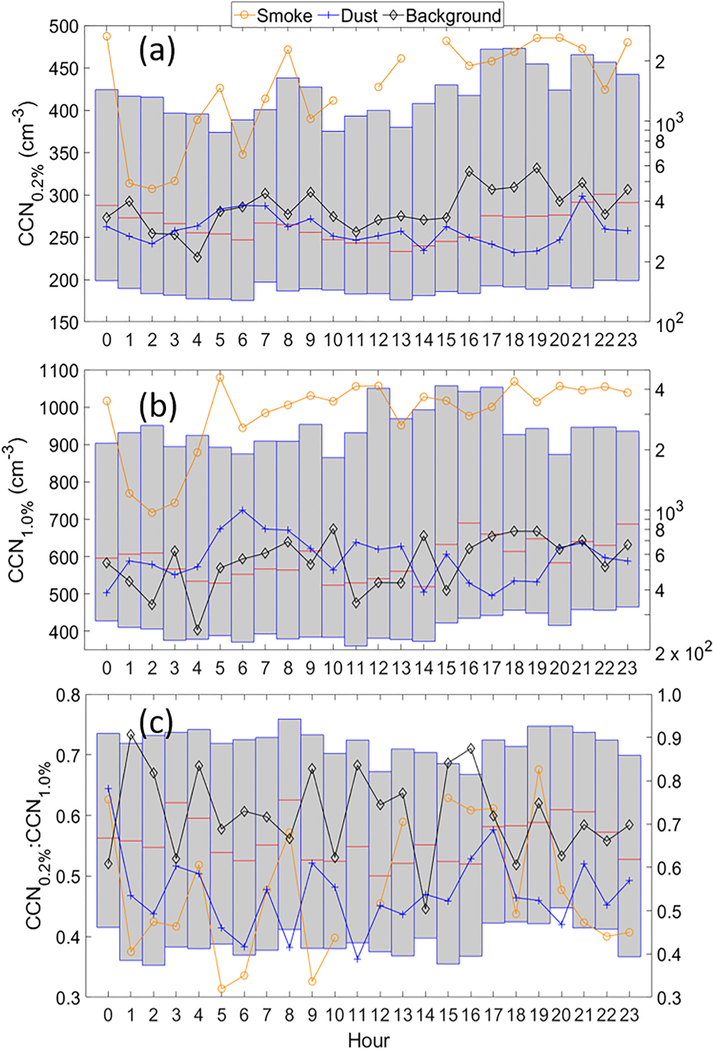
Fig. 6.
Diurnal statistics for (a) CCN0.2%, (b) CCN1.0%, and (c) CCN0.2%:CCN1.0% for the three categories listed in Table 2. The grey bars, which represent statistics for all 315 days in the study, are shown to contrast with values for each category. The red horizontal lines in each grey bar designate the median, while the bottom and top of the bars mark the 25th and 75th percentiles, respectively, at that given hour. The right y-axis applies to the smoke, dust, and background categories; the left y-axis applies to the grey bars only.

