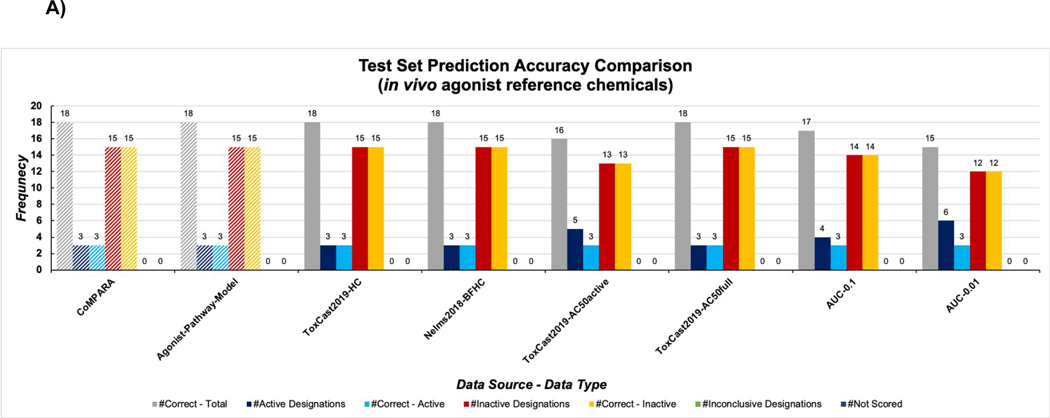
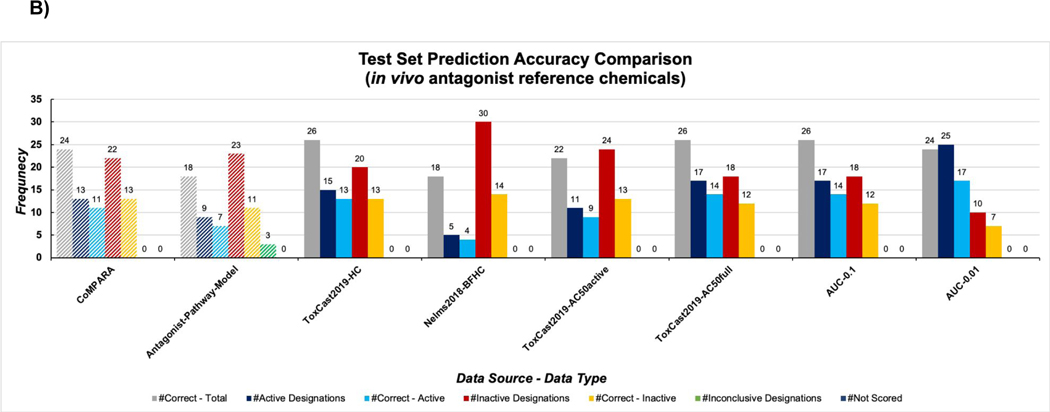
Figure 3:
Results for the in vivo agonist (A) and antagonist (B) test set across all machine learning model groups, in comparison to Kleinstreuer et al. 15 and CoMPARA consensus classifications 18. Navy bars indicate number of chemicals classified as active by the model group, blue bars indicate the number of correctly classified active chemicals, red bars indicate the number of chemicals classified as inactive by the model group, orange bars indicate the number of correctly classified inactive chemicals, and green bar represents inconclusive scores.


