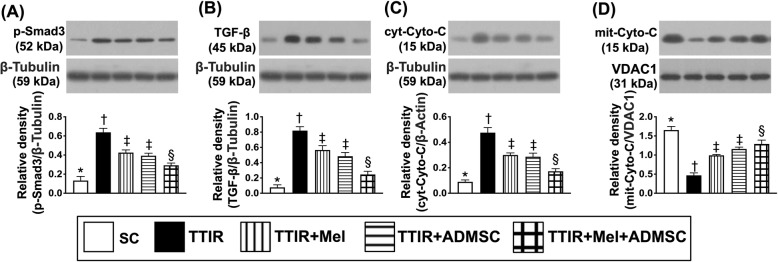
Fig. 2.
Mel-ADMSCs therapy inhibited the protein expressions of fibrosis and mitochondrial-damaged biomarker by 72 h after TTIR procedure. A Protein expression of Smad3, * vs. other groups with different symbols (†, ‡, §), p < 0.0001. B Protein expression of transforming growth factor (TGF)-ß, * vs. other groups with different symbols (†, ‡, §), p < 0.0001. C Protein expression of cytosolic cytochrome C (cyt-Cyto-C), * vs. other groups with different symbols (†, ‡, §), p < 0.0001. D Protein expression of mitochondrial cytochrome C (mit-Cyto-C), * vs. other groups with different symbols (†, ‡, §), p < 0.0001. All statistical analyses were performed by one-way ANOVA, followed by Bonferroni multiple comparison post hoc test (n = 6 for each group). Symbols (*, †, ‡, §) indicate significance (at 0.05 level)

