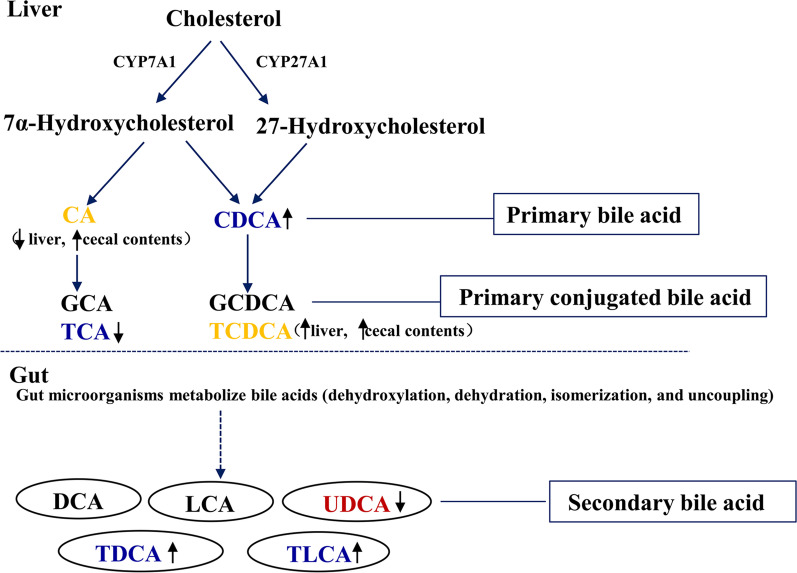
Fig. 5.
Bile acids metabolism pathway disturbed in the obese mice induced by a high-fat diet based on the metabolites of liver and cecum contents analysis. Metabolites names in blue or red indicated they were found in liver or cecum contents, respectively, and the metabolites in orange were found in both. The increased trend was indicated by ↑ and decreased trend was indicated by ↓. CA cholic acid, CDCA chenodeoxycholic acid, TCA taurocholic acid, TCDCA taurochenodeoxycholic acid, TDCA taurodeoxycholic acid, TLCA taurolithocholic acid, UDCA ursodeoxycholic acid

