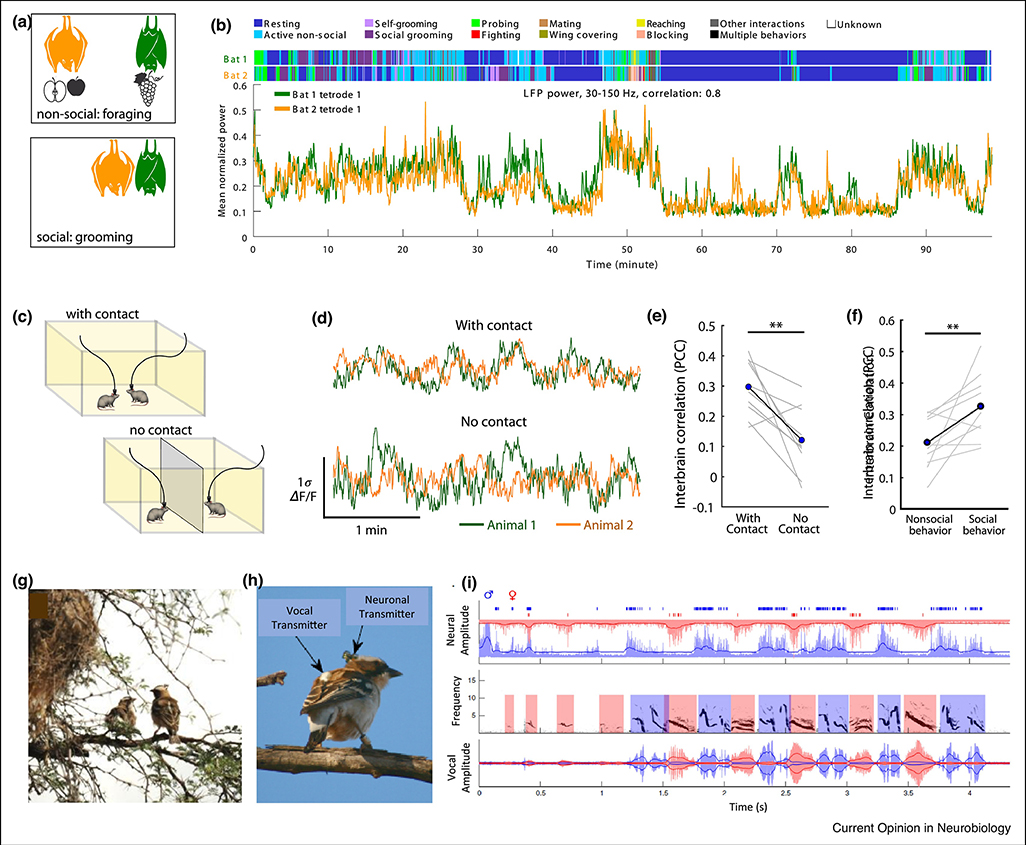
Figure 1. Neural synchrony in socially interacting bats (A-B), mice (C-F) and birds (G-I).
(A-B) Wireless recordings from the frontal cortex of freely behaving pairs of bats, which exhibited a range of both social and non-social behaviors, such as grooming or foraging (A), and showed high inter-brain synchrony. (B) Mean normalized LFP power in the 30–150 Hz band during an example session, simultaneously recorded from two bats. Annotated behaviors are shown above. (C-F) Calcium imaging of neural activity from dmPFC neurons in freely behaving mice revealed inter-brain synchrony. Mice were studied in contact or separated (C). (D) Calcium traces of overall dmPFC activity (mean activity) revealed higher inter-brain correlation in mice that were in contact (E) and that were socially interacting (F). (G-I) Electrophysiological recordings from song birds’ HVC during duetting in their natural habitat (G), using wireless vocal and neuronal transmitters (H). (I) Vocalizations were locked to bursts of premotor HVC activity in the singing bird. Male, blue; female, red. Top panel: neural traces. Middle panel: spectrogram. Lower panel: vocal amplitude. Both male and female are shown for exemplary duet bouts initiated by the female. Solid dark blue and dark red lines outline the root-mean-square envelope of neural and vocal signals. Times of spike occurrence are indicated by blue rasters. Note the precise alternation of neural bursts between interacting males and females. Panels A-B adapted from [56], panels C-F adapted from [57] and panels G-I adapted from [59], with permission.

