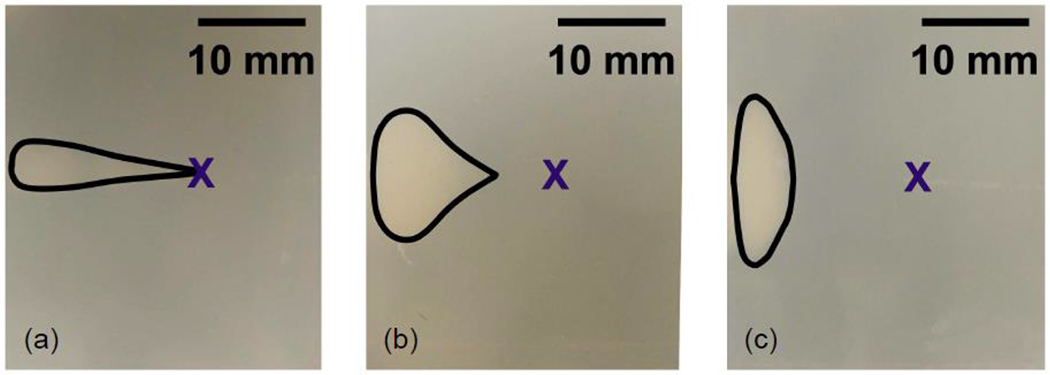
Figure 10:

Photographs of the phantom showing the lesion produced during HIFU exposure at 6 MPa, at low (a), medium (b), and high (c) microbubble concentration. The lesion shifts closer to the transducer (left side of images) as the concentration of microbubbles is increased due to attenuation of the sound field by the microbubbles. The X in the images marks the location of the focus.
