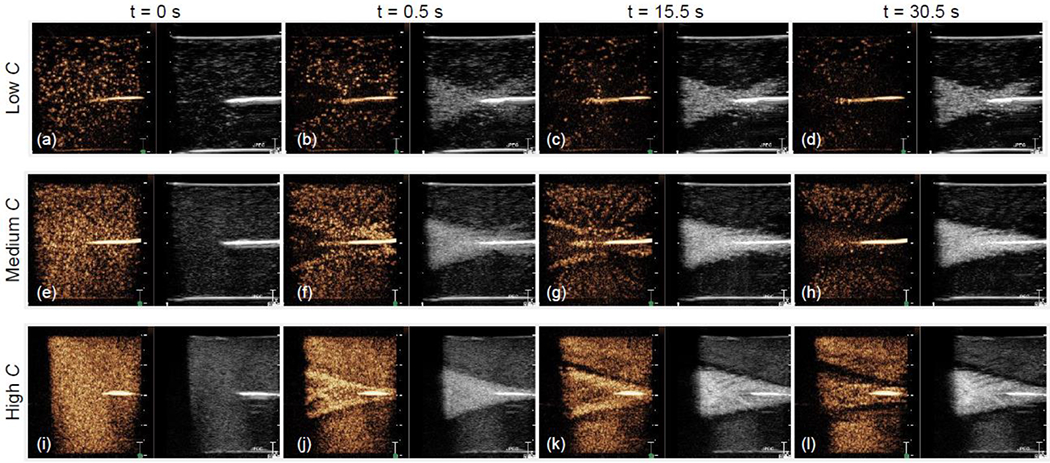
Figure 5:

Ultrasound images acquired during HIFU treatment at 2.0 MPa for three microbubble concentrations. The left-side orange-colored images are nonlinear contrast-enhanced ultrasound images (obtained with amplitude modulation) and the right-side greyscale images are conventional fundamental B-mode images. The echoes in the contrast images are produced by resonant nonlinearly oscillating microbubbles and in the B-mode images are produced by larger (not-resonant) bubbles produced during the HIFU treatment.
