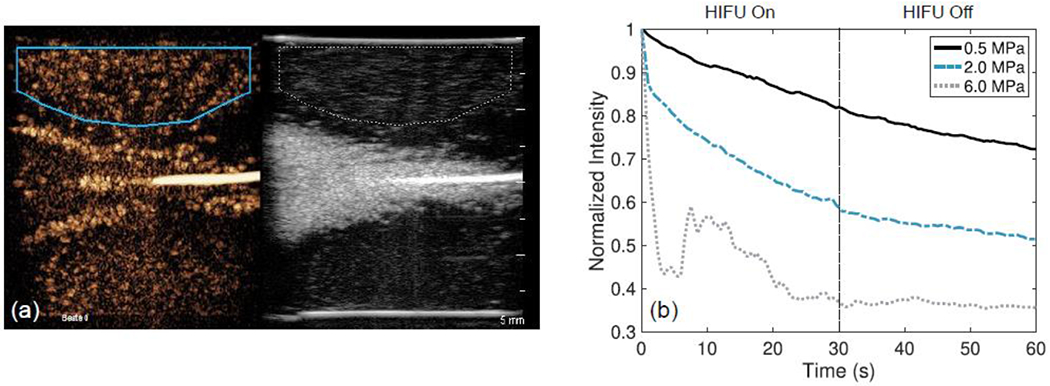
Figure 8:

QLAB region of interest analysis performed on DICOM loops for the medium concentration of microbubbles at 0.5 MPa (solid line), 2.0 MPa (dash-dotted line), and 6.0 MPa (dotted line). (a) Displays an example region of interest selected on the medium-concentration phantom treated at 2.0 MPa. (b) The image intensity in the region of interest over time.
