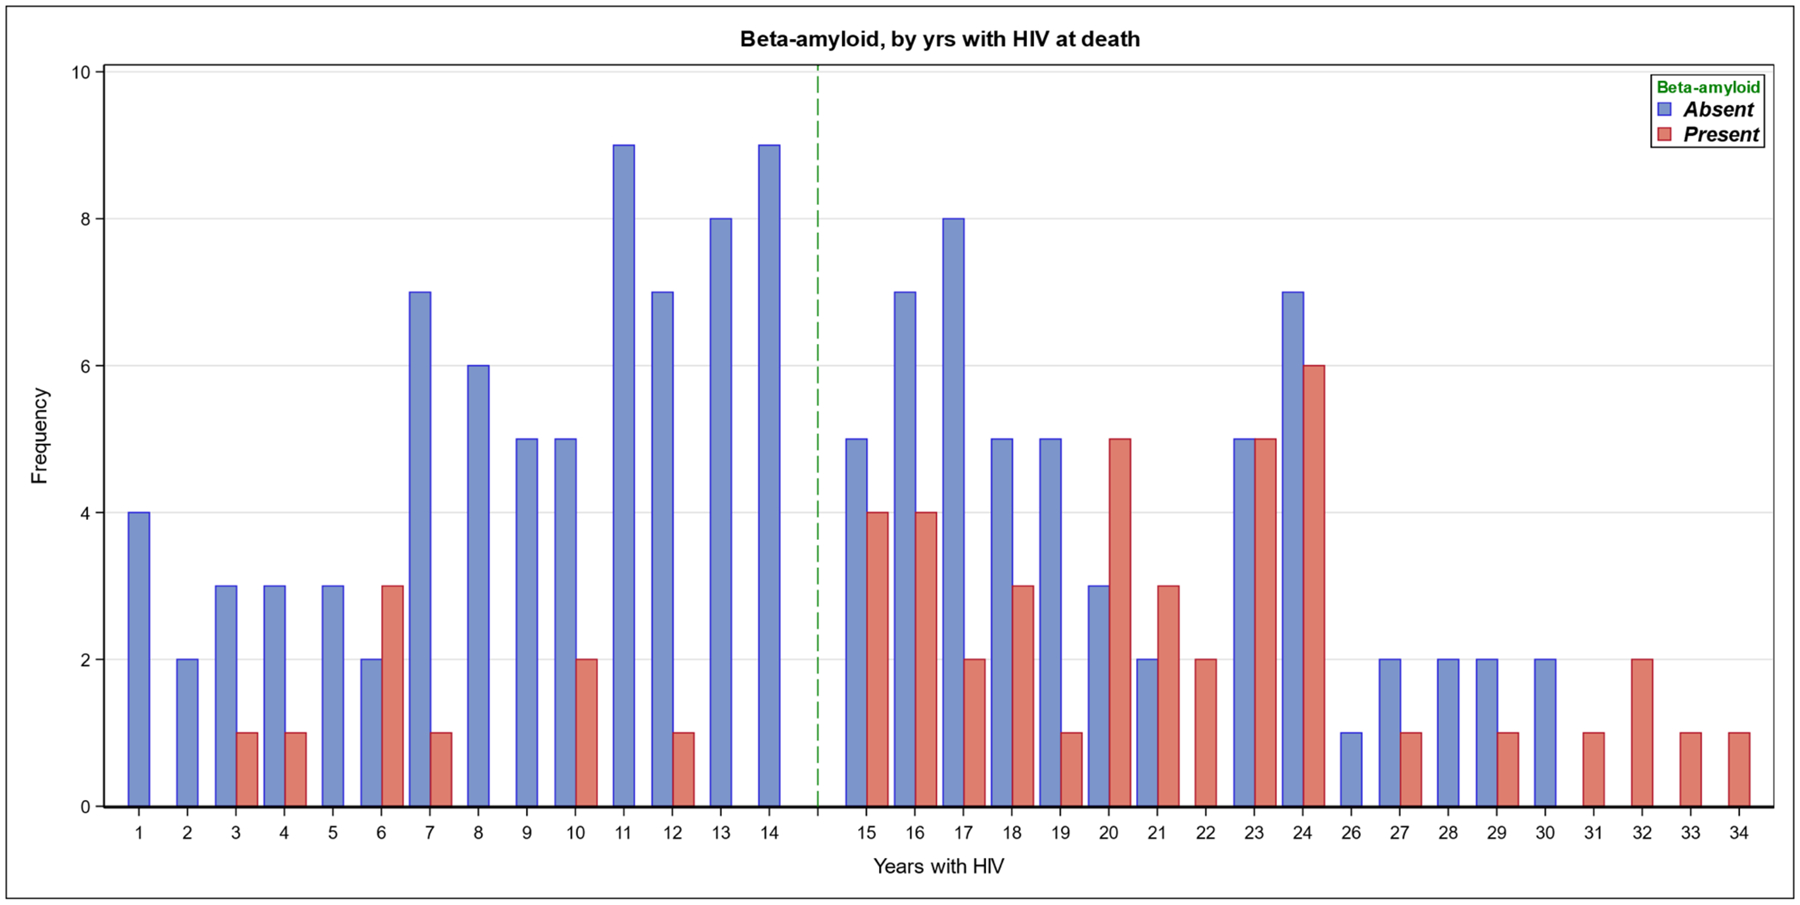
Figure 1.

Aβ accumulation by years duration of HIV infection Numbers of HIV+ individuals with (red bars) or without (blue bars) cortical Aβ deposition, displayed by the number of years HIV disease duration. The median of the distribution for HIV duration is 15 years, denoted by a dotted line. The frequency of Aβ deposition demonstrates a significant increase at and above the median.
