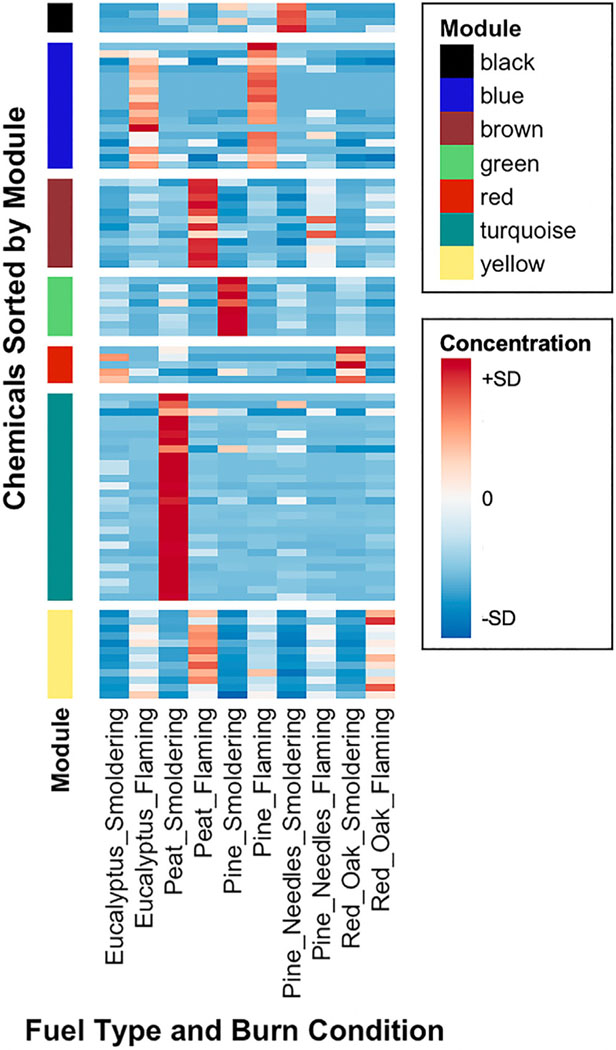
Fig. 1.
Heat map of the chemical concentrations measured in biomass smoke condensate samples, with chemicals organized into modules based on co-occurrence. For specific chemicals organized per module, alongside chemical class, see Table 1. Chemical concentrations are z-score normalized across biomass burn samples. Note that module groups are indicated by color and appear in the same order within the heat map as in the legend.

