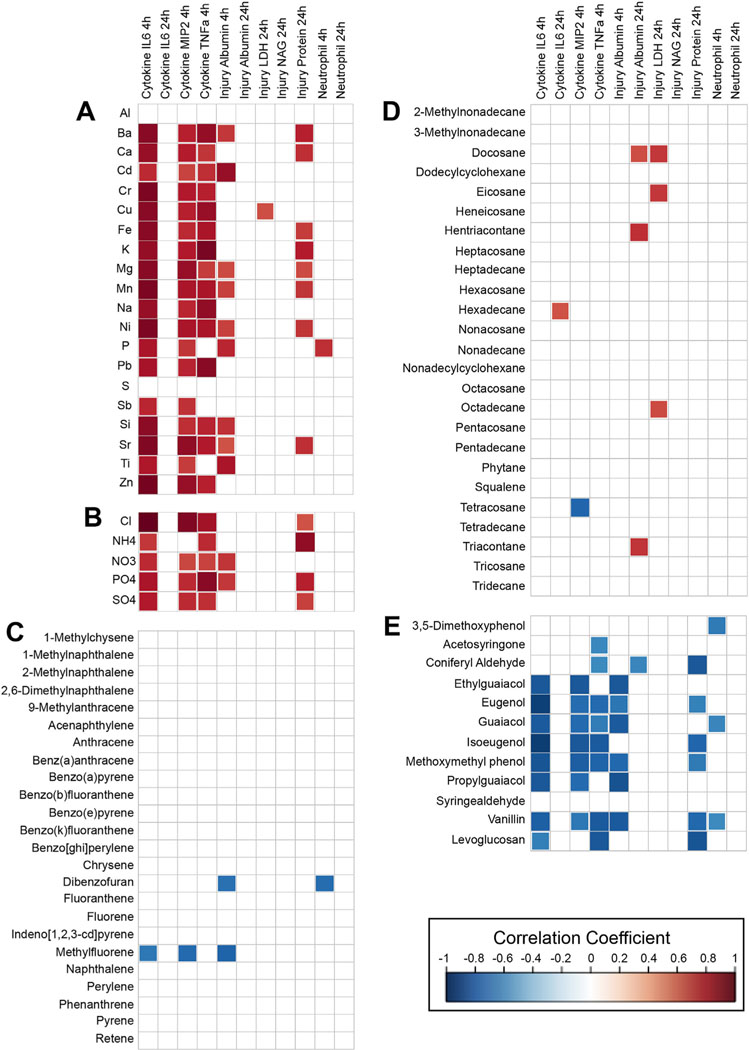
Fig. 5.
Correlations between individual chemicals and biological endpoints, arranged according to the following chemical classes: (A) inorganic elements, (B) ionic constituents, (C) PAHs, (D) n-alkanes, and (E) methoxyphenols and levoglucosan. Significant (p < 0.05) correlations are shown as colored squares, and white squares reflect insignificant correlations.

