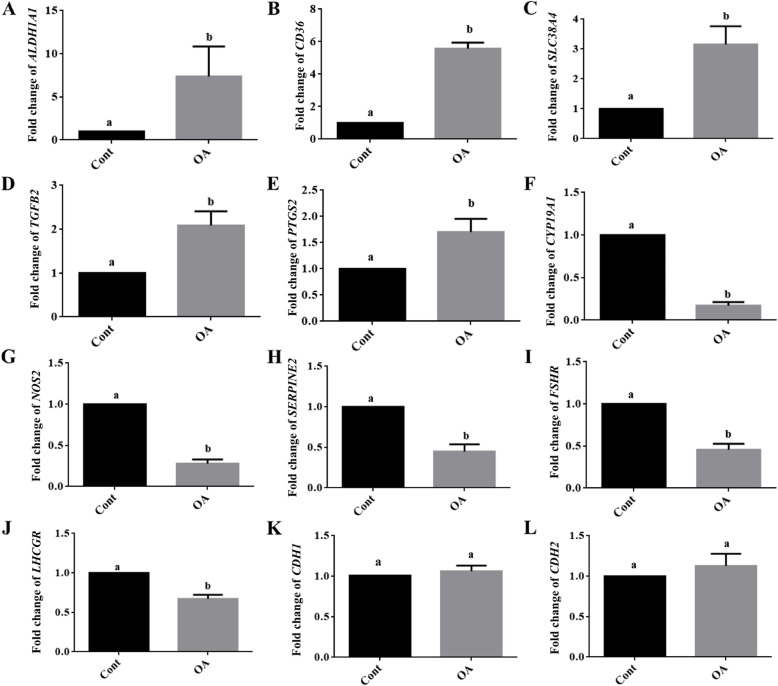
Fig. 2.
Microarray data validation by real-time RT PCR. The abundance of different transcripts from OA affected and non-affected genes were analyzed by real-time RT-PCR. The results clearly showed that ALDH1A1, CD36, SLC38A4, TGFB2 and PTSG2 were up-regulated (A-E), CYP19A1, NOS2, SERPINE2, FSHR, LHCGR, (F-J) were down-regulated and CDH1 and CDH2 (K, L) were unaffected by OA treatment thus confirming the microarray data. GC samples were analyzed after 8 days in culture under stimulatory conditions with FSH and IGF-1 supplementation throughout the time of culture and OA or vehicle treatment from day 2. Different letters indicate significant differences relative to the respective controls, which were set to one (mean fold change ± standard deviation, P < 0.05, one-way ANOVA from four independent experiments). Cont denotes vehicle controls and OA denotes oleic acid treatment

